Test Flows
Overview of Test Flows
The “Test Flow” feature in Sparrow is designed to enable users to build and manage comprehensive test sequences for API behavior validation within their projects. This functionality is crucial for verifying API performance under various conditions and scenarios.
Different Ways to Add Test Flows
There are several methods to add a Test Flow connection in your application. Below are the primary approaches:
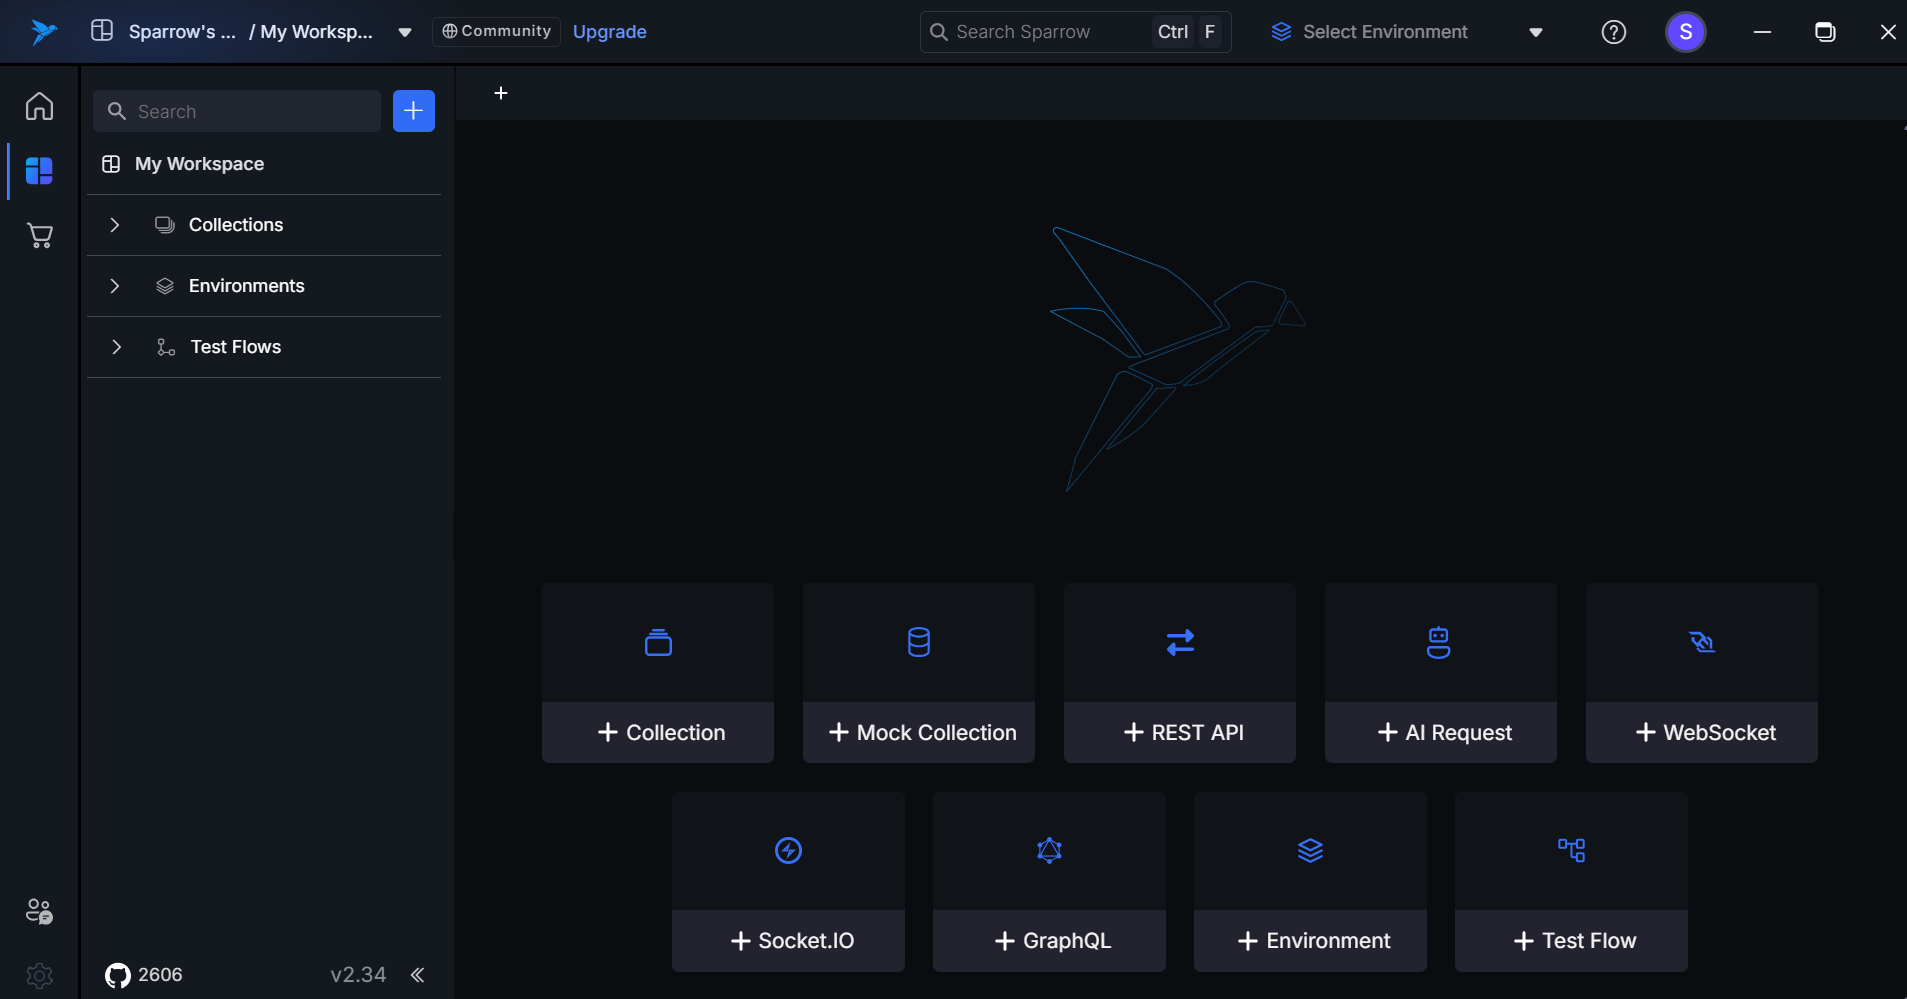
1. From Main Screen
Users can easily add a Test Flow connection directly from the main screen of the application. This method provides a straightforward interface, allowing for quick setup without navigating through multiple menus.
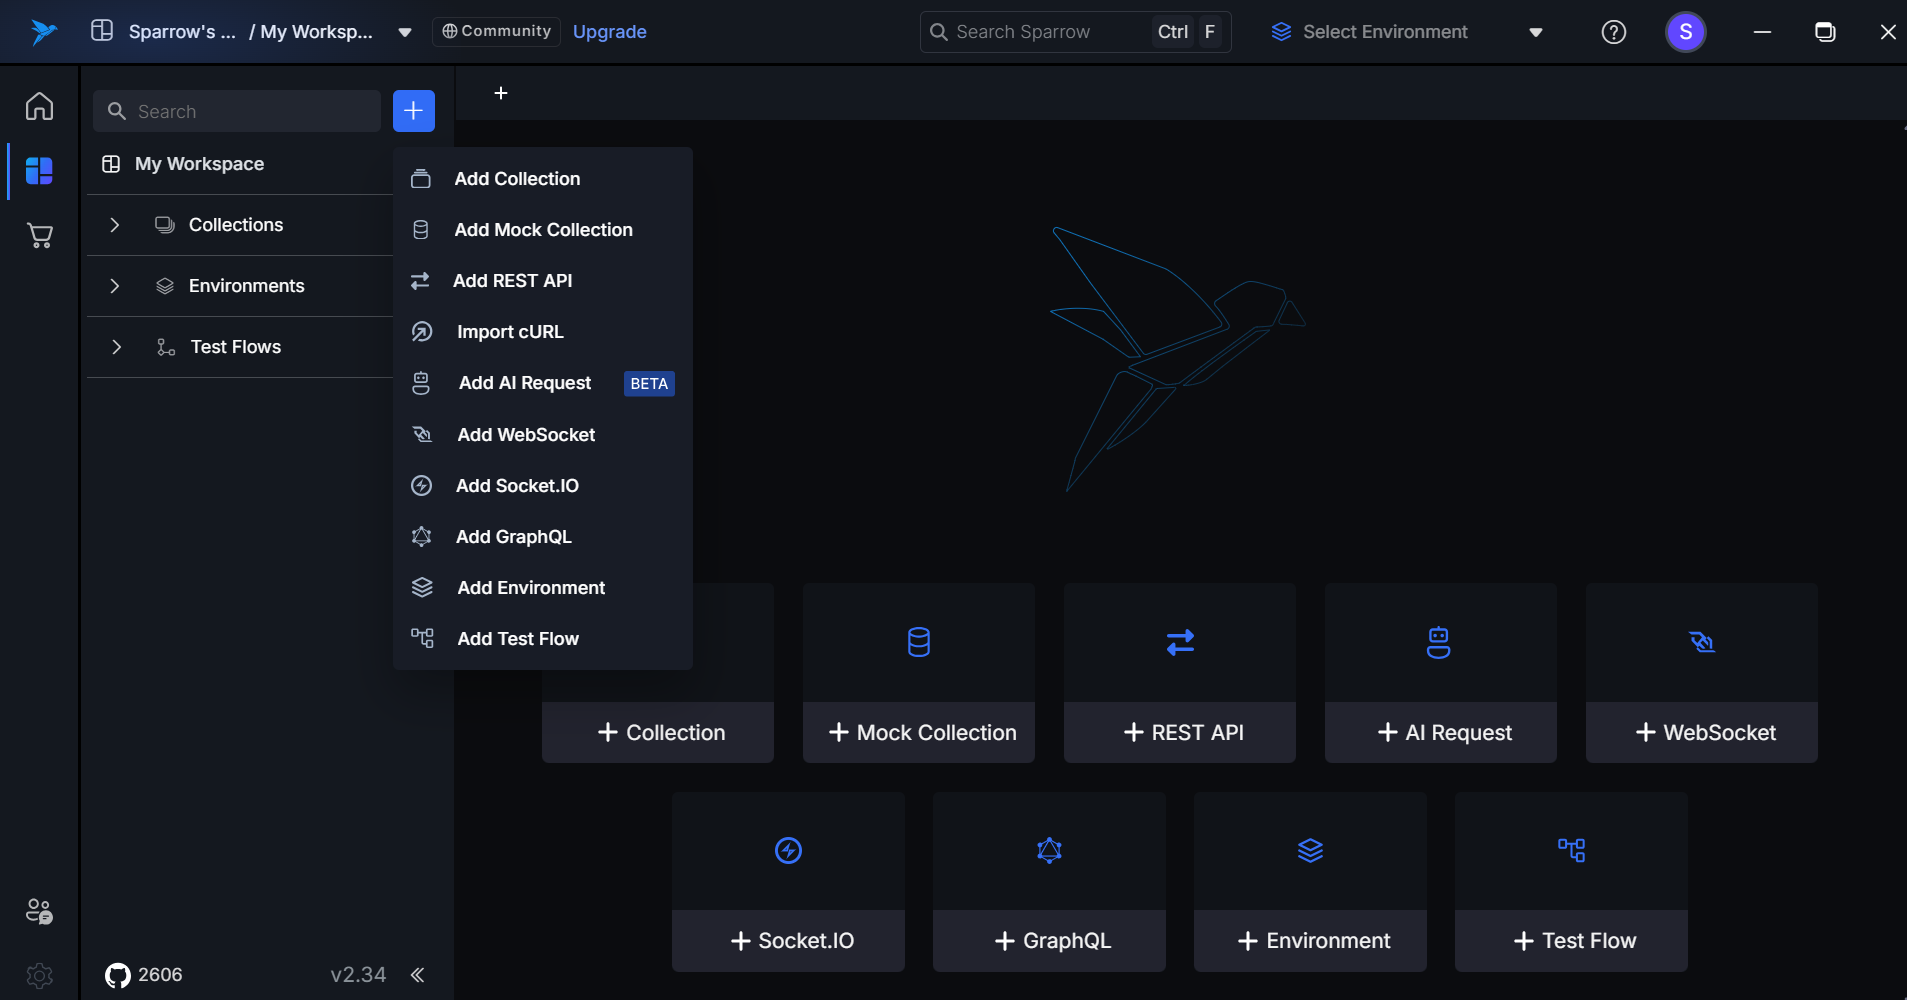
2. From the Left-Panel Section
Users can also add a Test Flow from the left panel for quick access.
Steps:
- Open the application.
- Click the "+" button present on the left side of the panel.
- Select the "Add Test Flow" option from the dropdown.
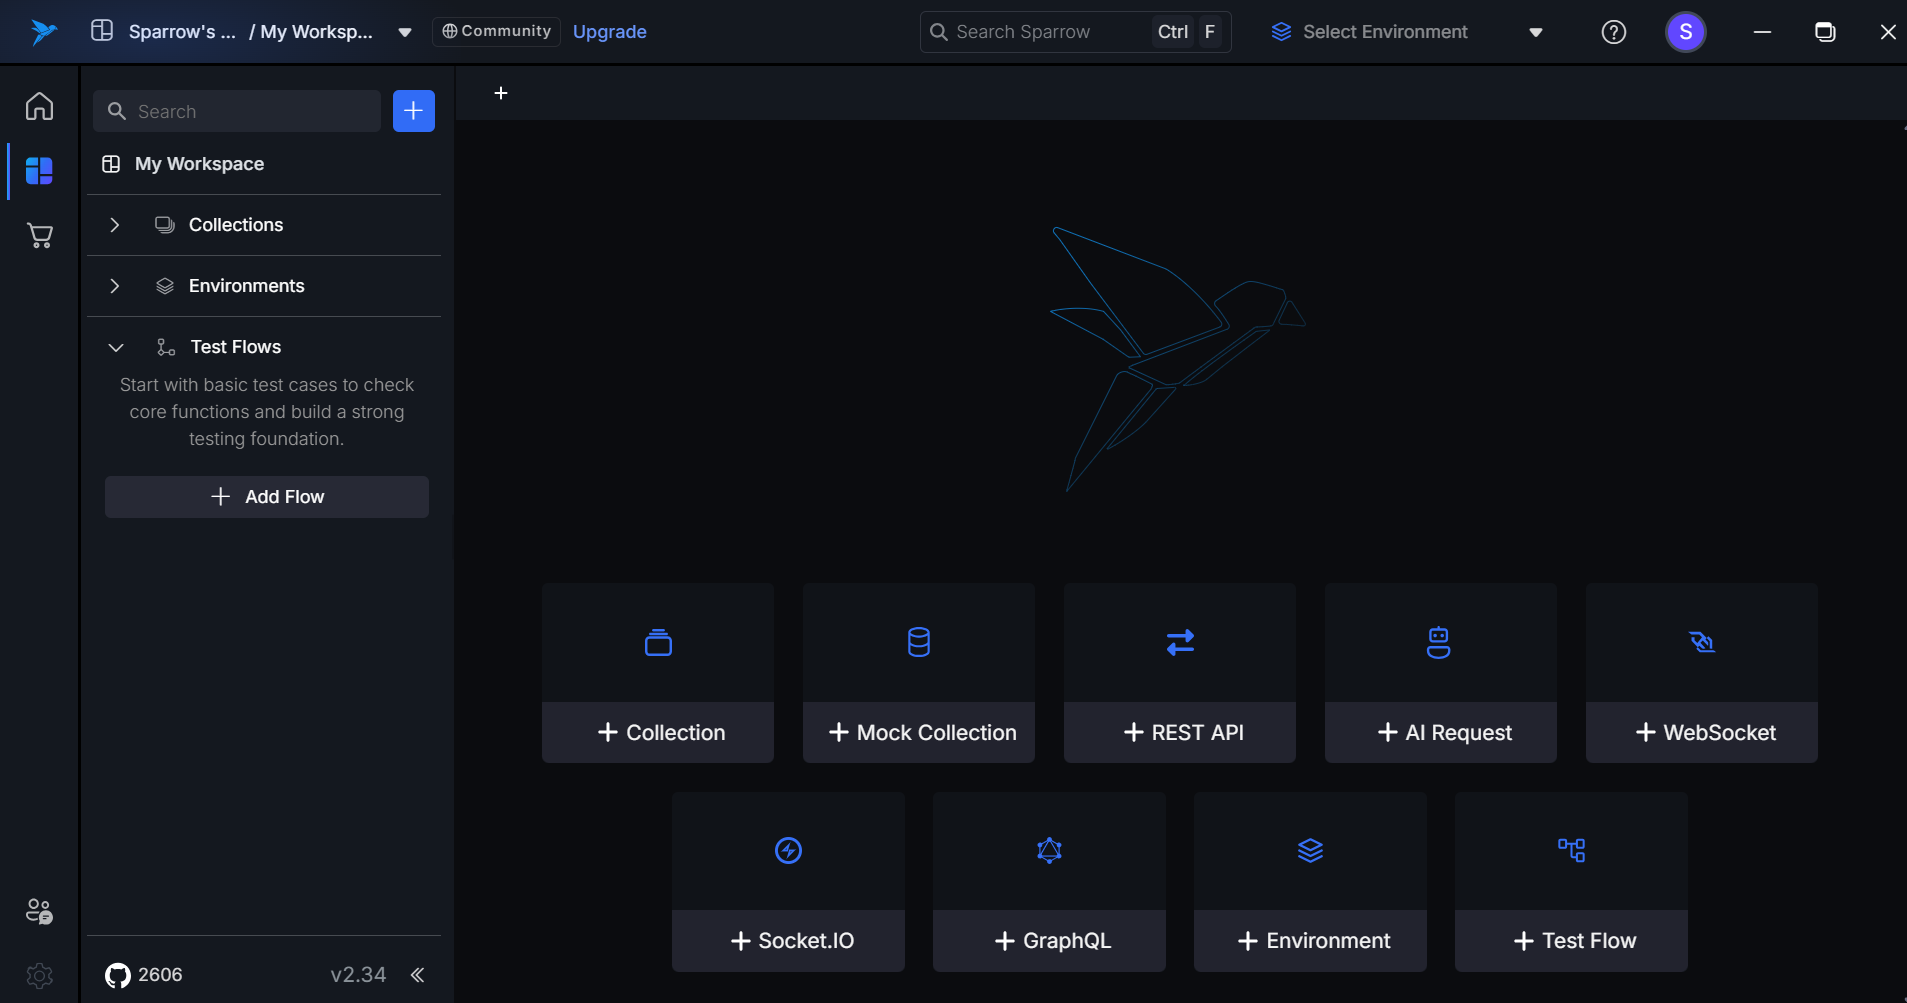
3. From the Test Flows Section
Users can also add a Test Flow from the Test Flows section.
Steps:
- Open the application.
- Click the "Test Flow" option present on the left side of the panel.
- Click on the "+ Add New Flow" option.
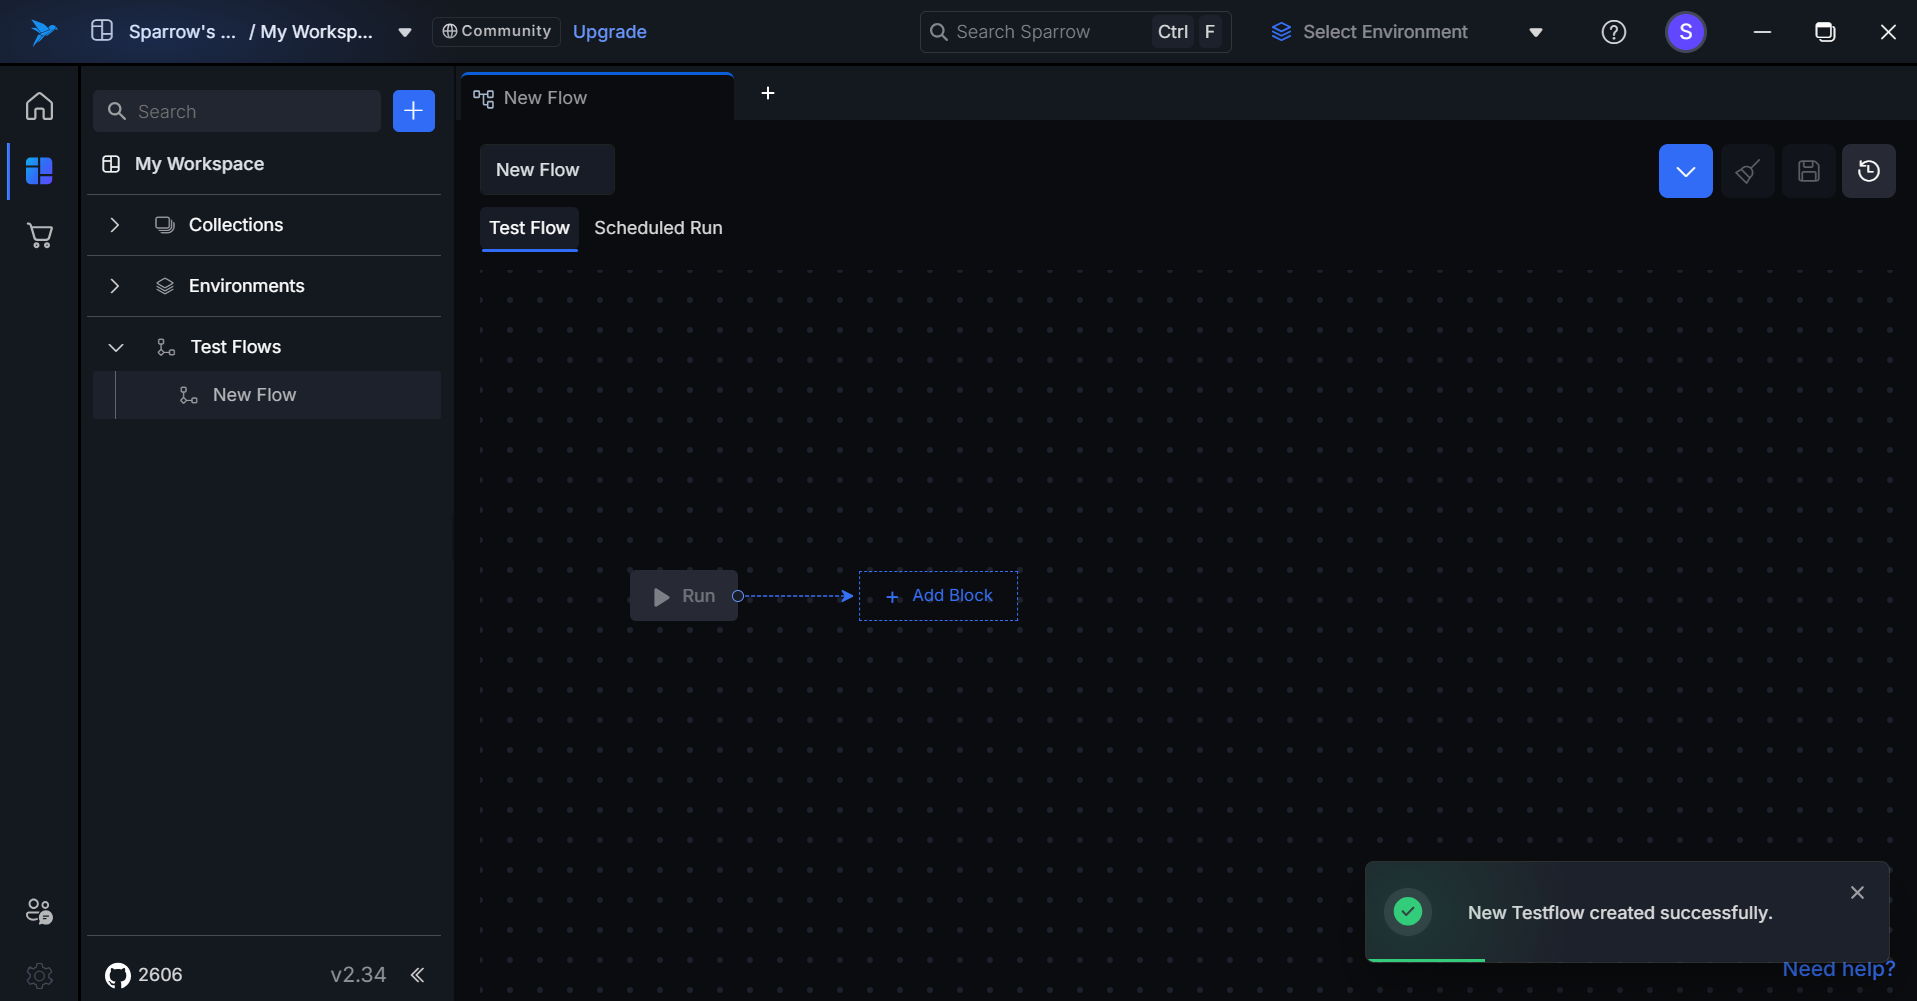
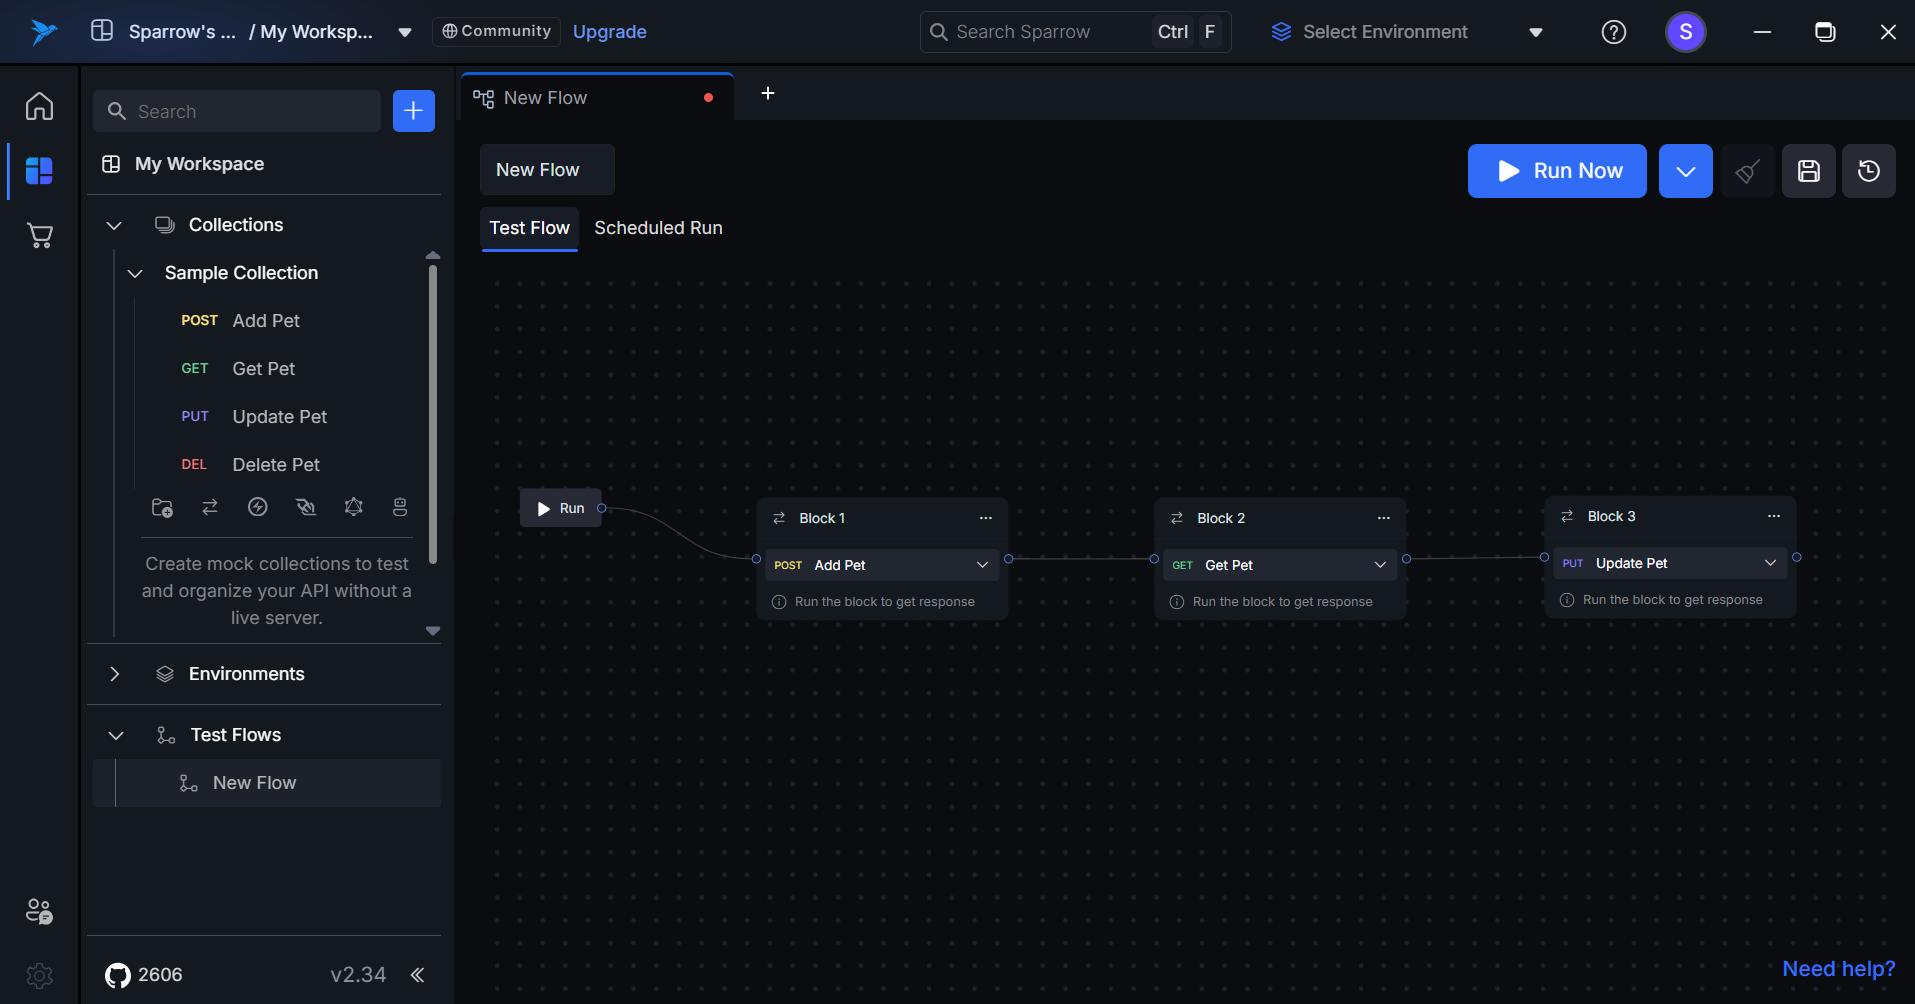
Default Test Flow Interface
When the user clicks on "Add Flow," they will be directed to the Test Flow home page. This page includes several key elements:
- Flow Name: A field to enter the name of the test flow.
- Save and History Buttons: Options to save the current flow and view the history of previously created flows.
- Start Button: This button initiates the test flow execution.
- Add Block Button: Users can click this to add new blocks, allowing for the inclusion of multiple steps or scenarios within the test flow.
How to Create a Test Flow
- Open the Sparrow Application: Launch the Sparrow application on your device.
- Click on "+ Test Flow": On the main menu, select the "+ Add Test Flow" option.

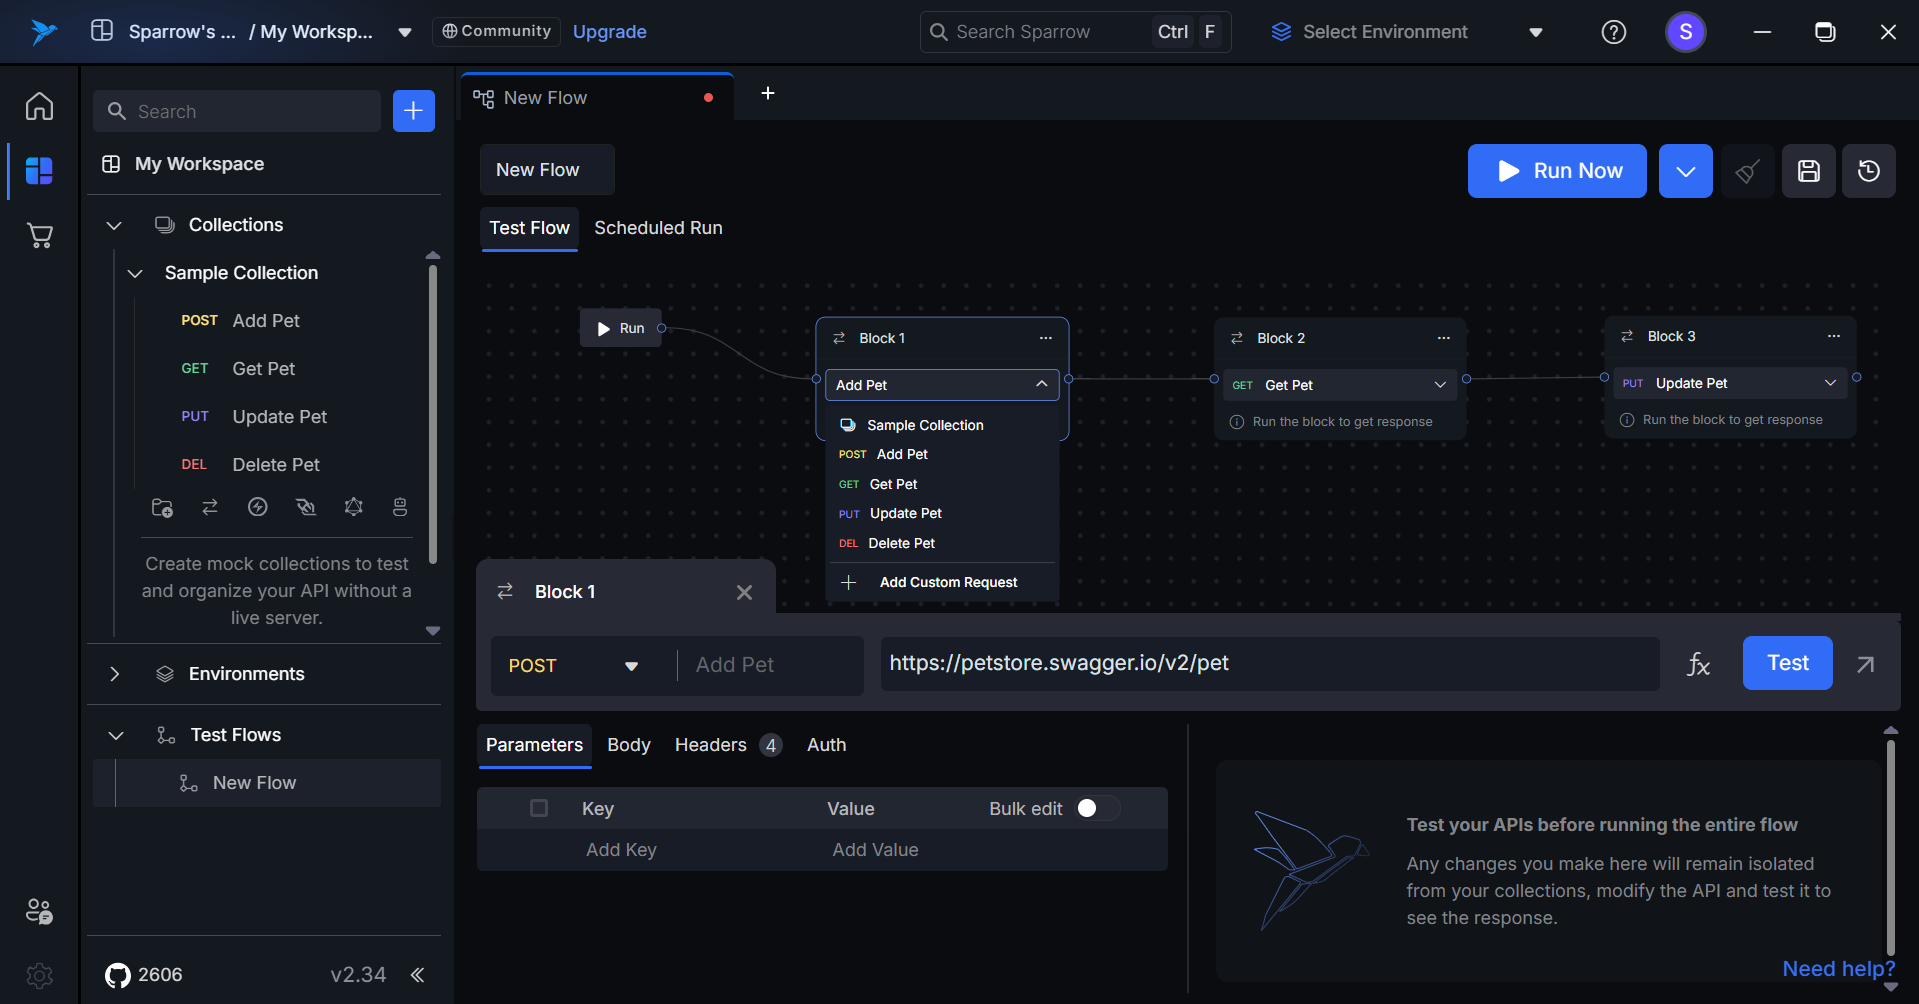
- Add a Block: Click on the Add Block button to open a new block for adding APIs.

- Select REST API: You can either drag and drop the REST API from the left panel or choose the required REST API from the dropdown menu in the block (Collection-Folder-REST API).
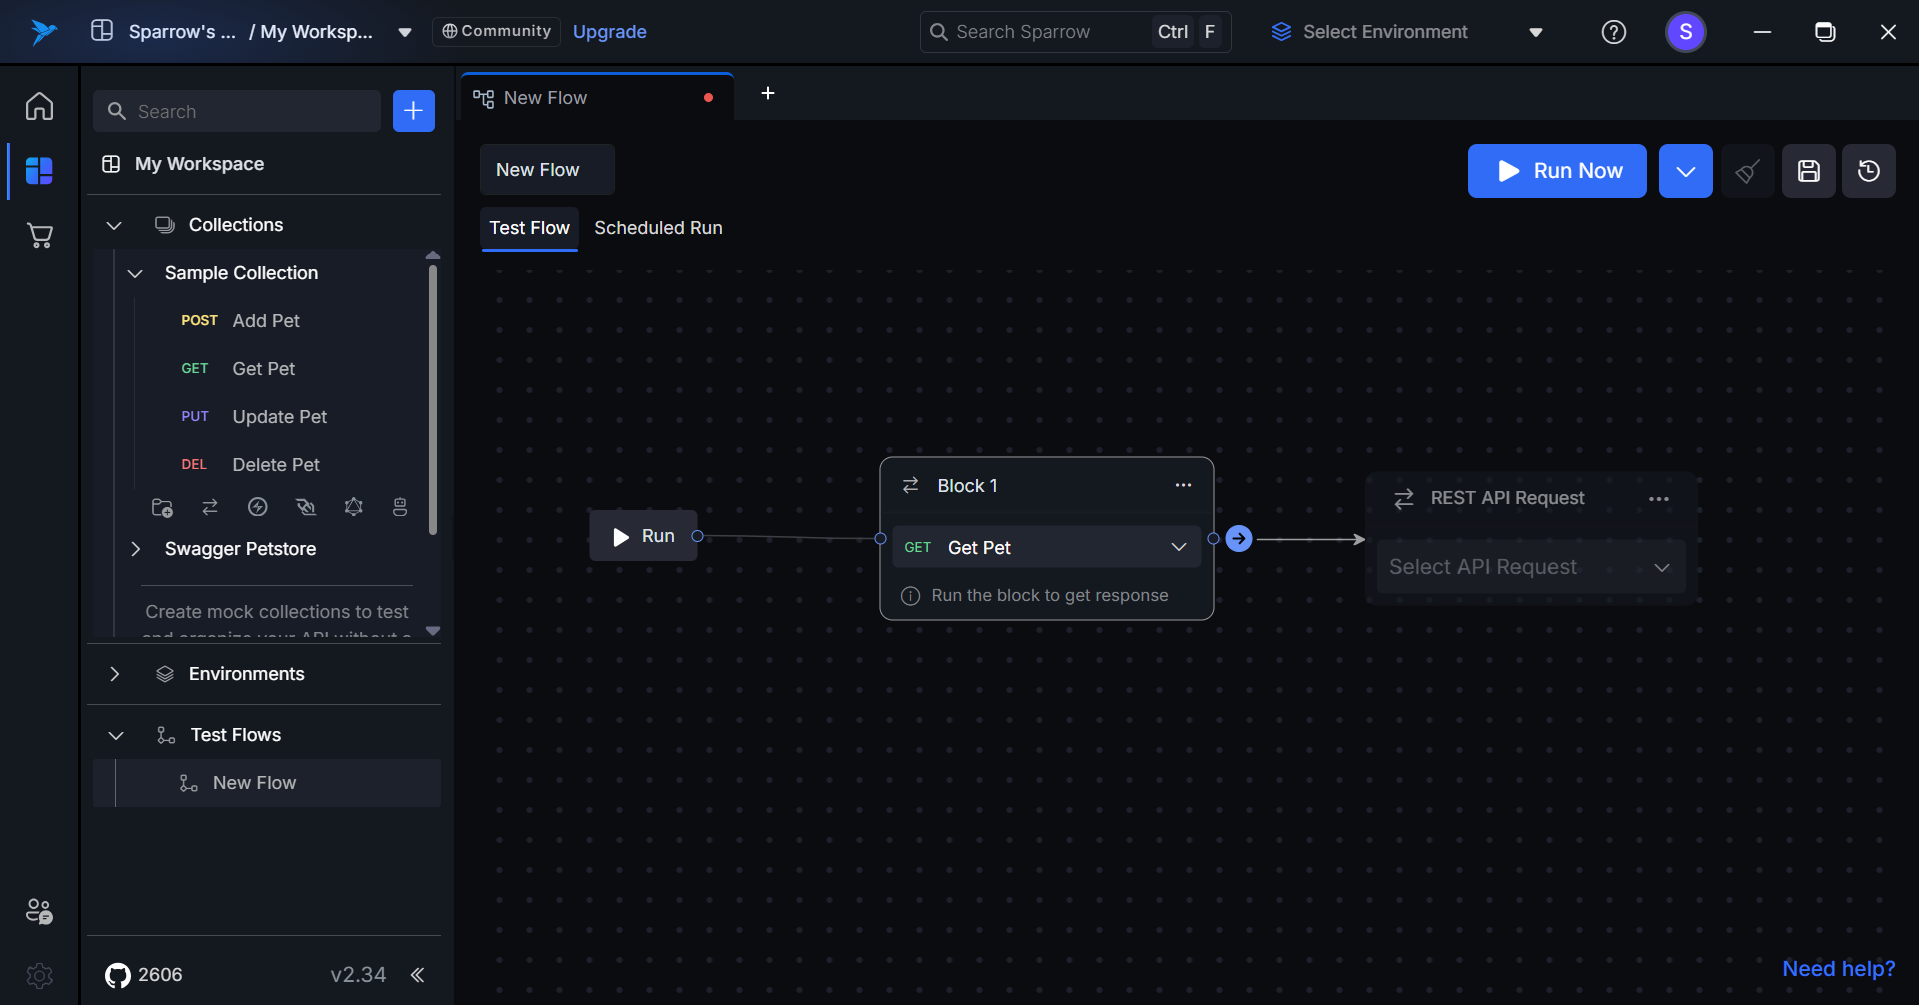
- Proceed to the Next Step: Click the Next button to continue adding the selected REST API to the flow.
- Add API to the Flow: Complete the process by adding the selected REST API into the test flow.
How to Edit or Delete API Blocks
Users have the capability to edit or delete API blocks within the test flow. Editing allows users to modify existing APIs to better fit their testing needs. If a block is no longer required or relevant, users can easily delete it, ensuring that the test flow remains organized and focused. This functionality enhances the flexibility and efficiency of managing test flows.
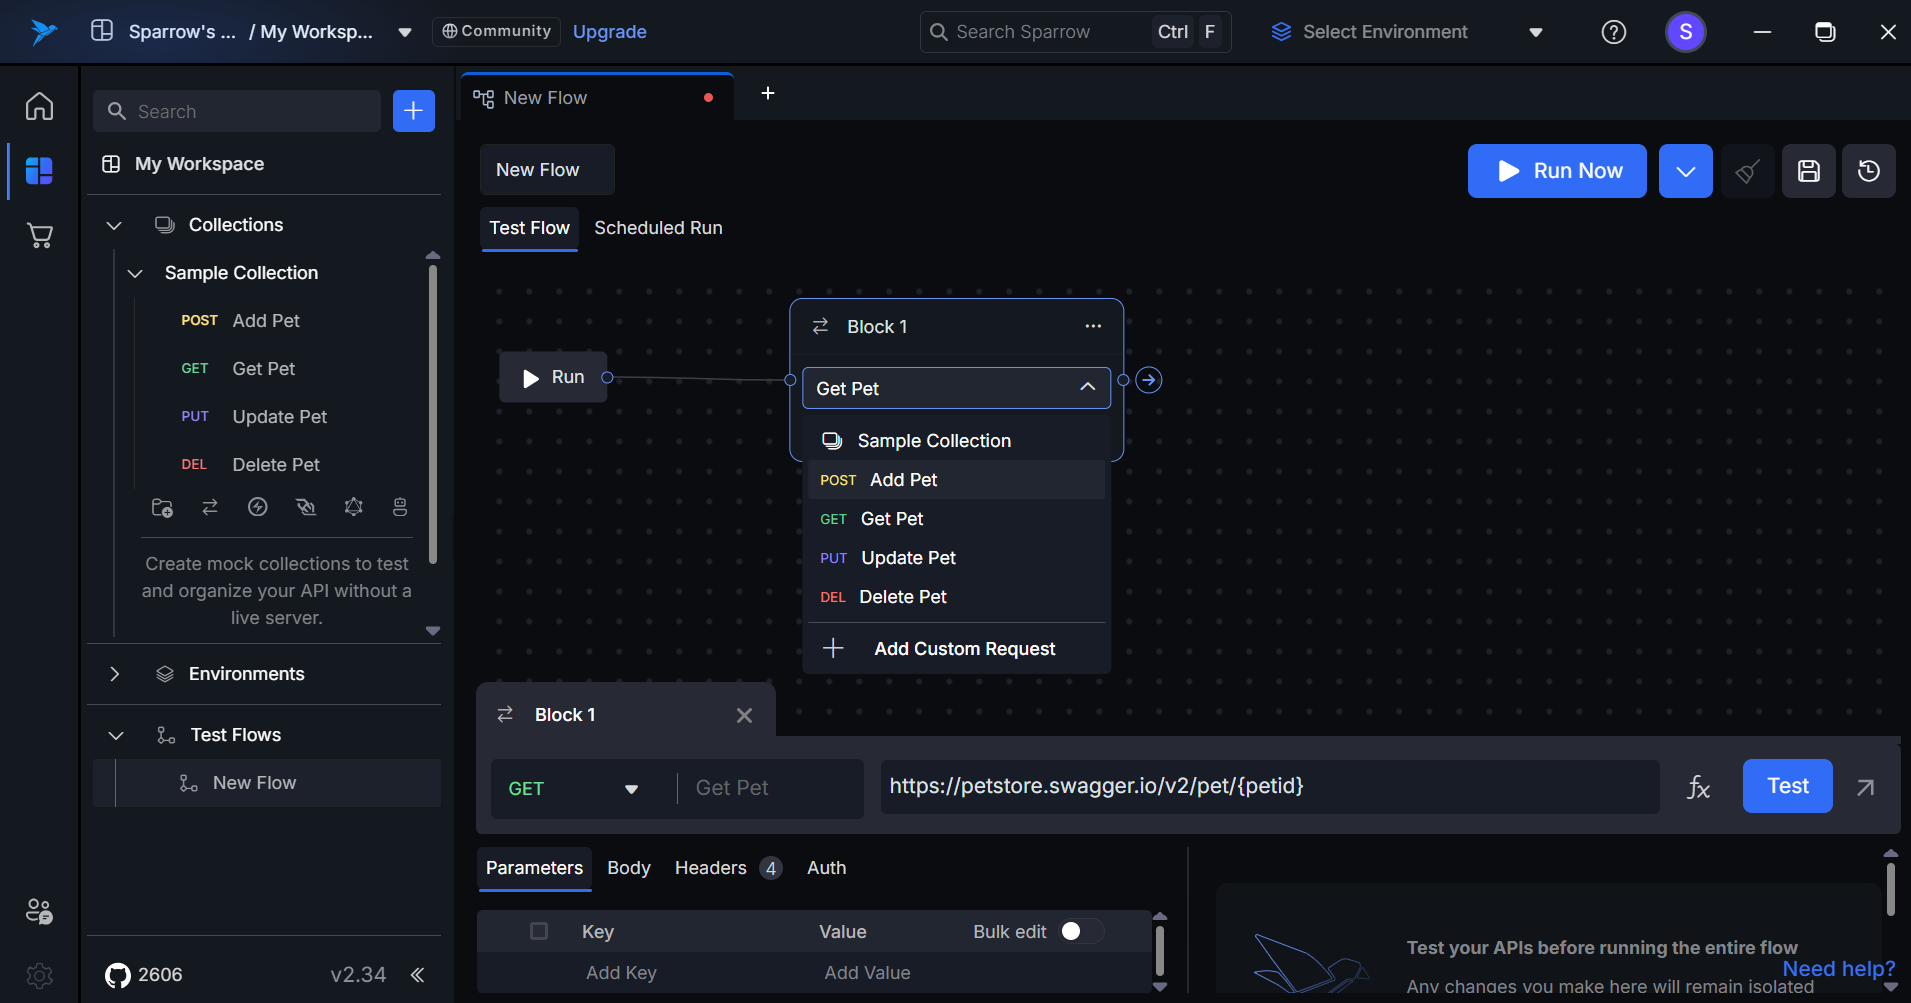
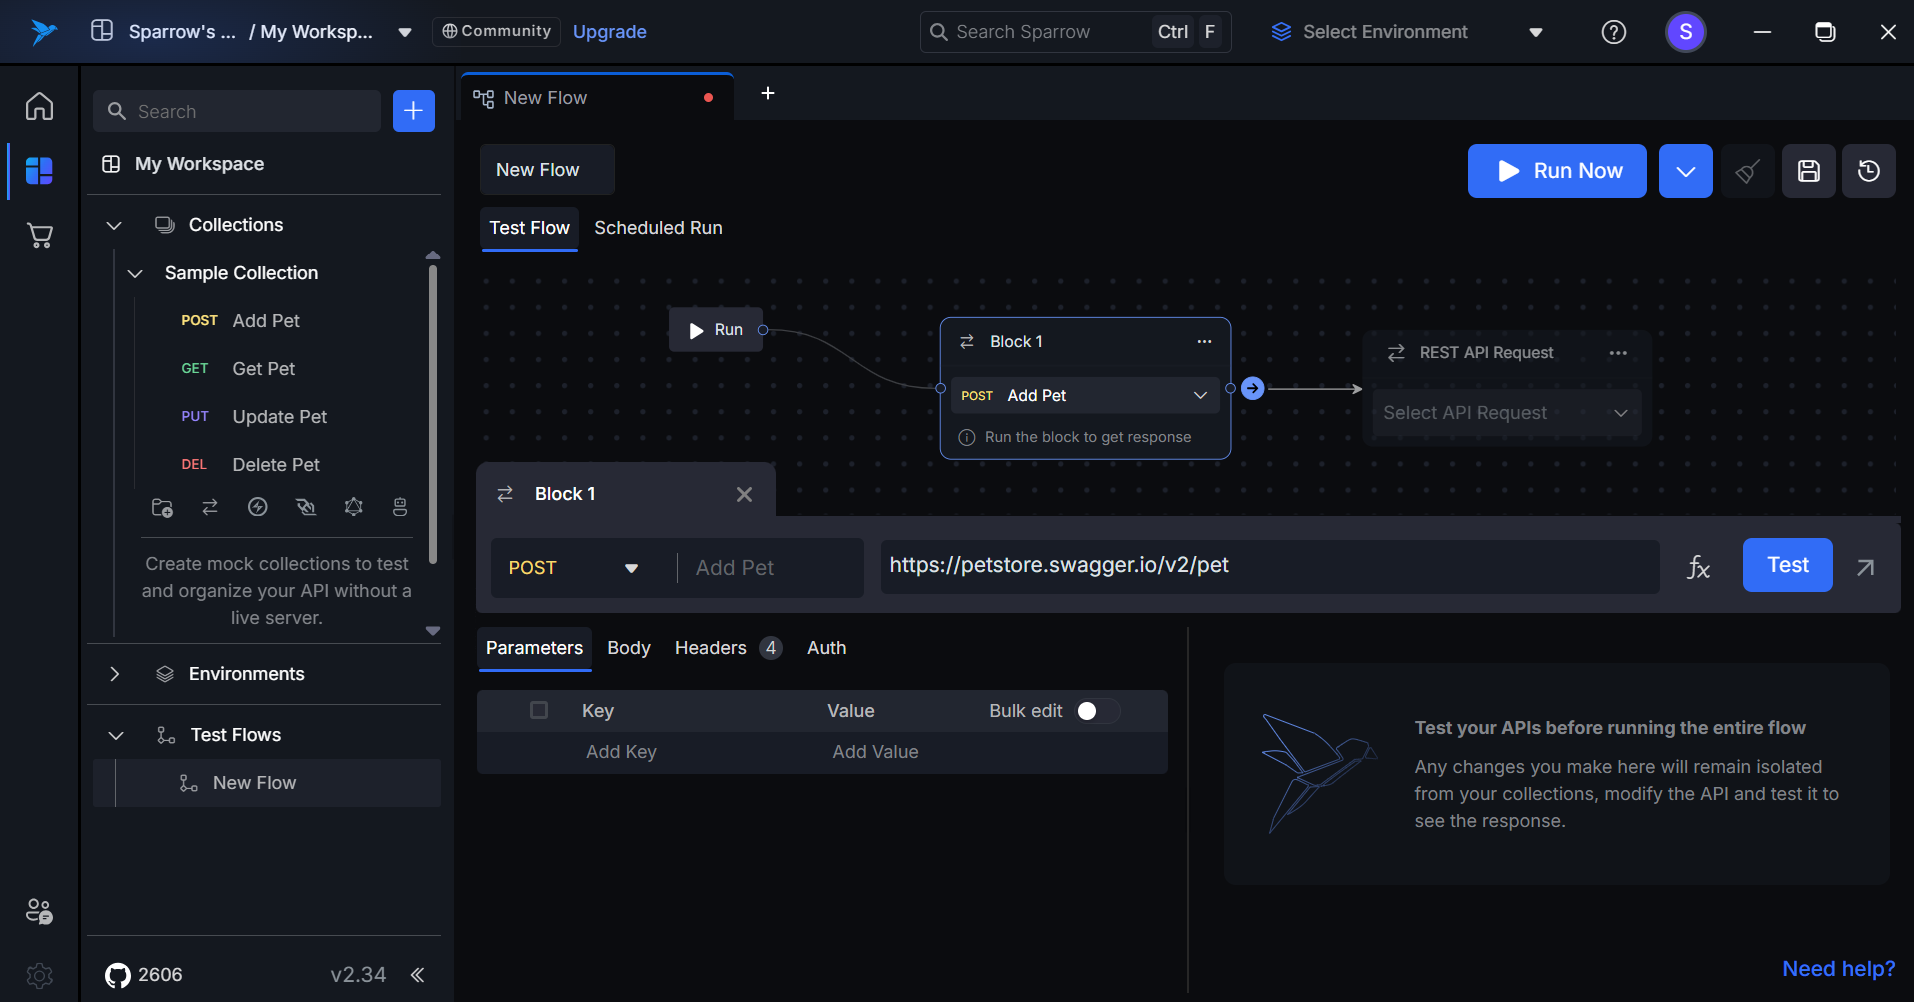
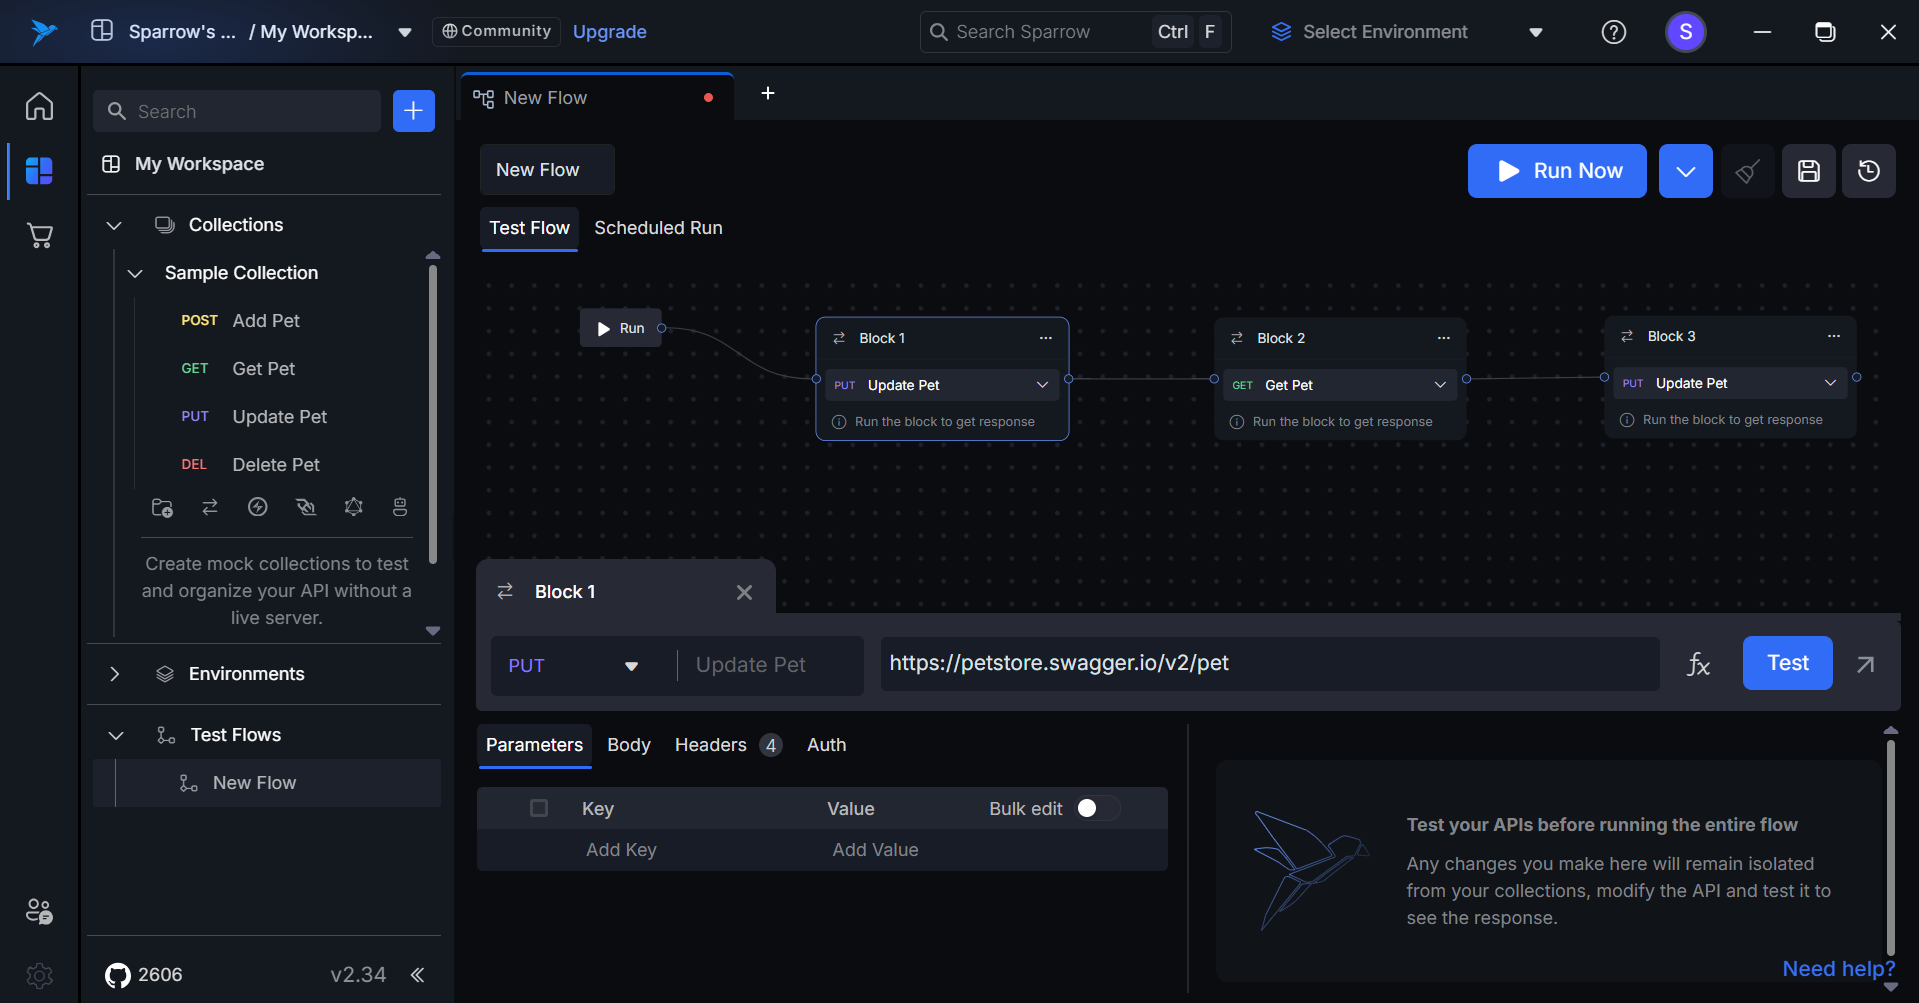
Edit/Change the API Present in the Block
To edit or change the API present in a block, follow these steps:
- Click on the API: Select the API present in the block that you wish to change.
- Select New API Location: Choose the location of the new API by selecting the appropriate collection and folder.
- View Updated API: The newly updated API will appear in that block, reflecting your changes.
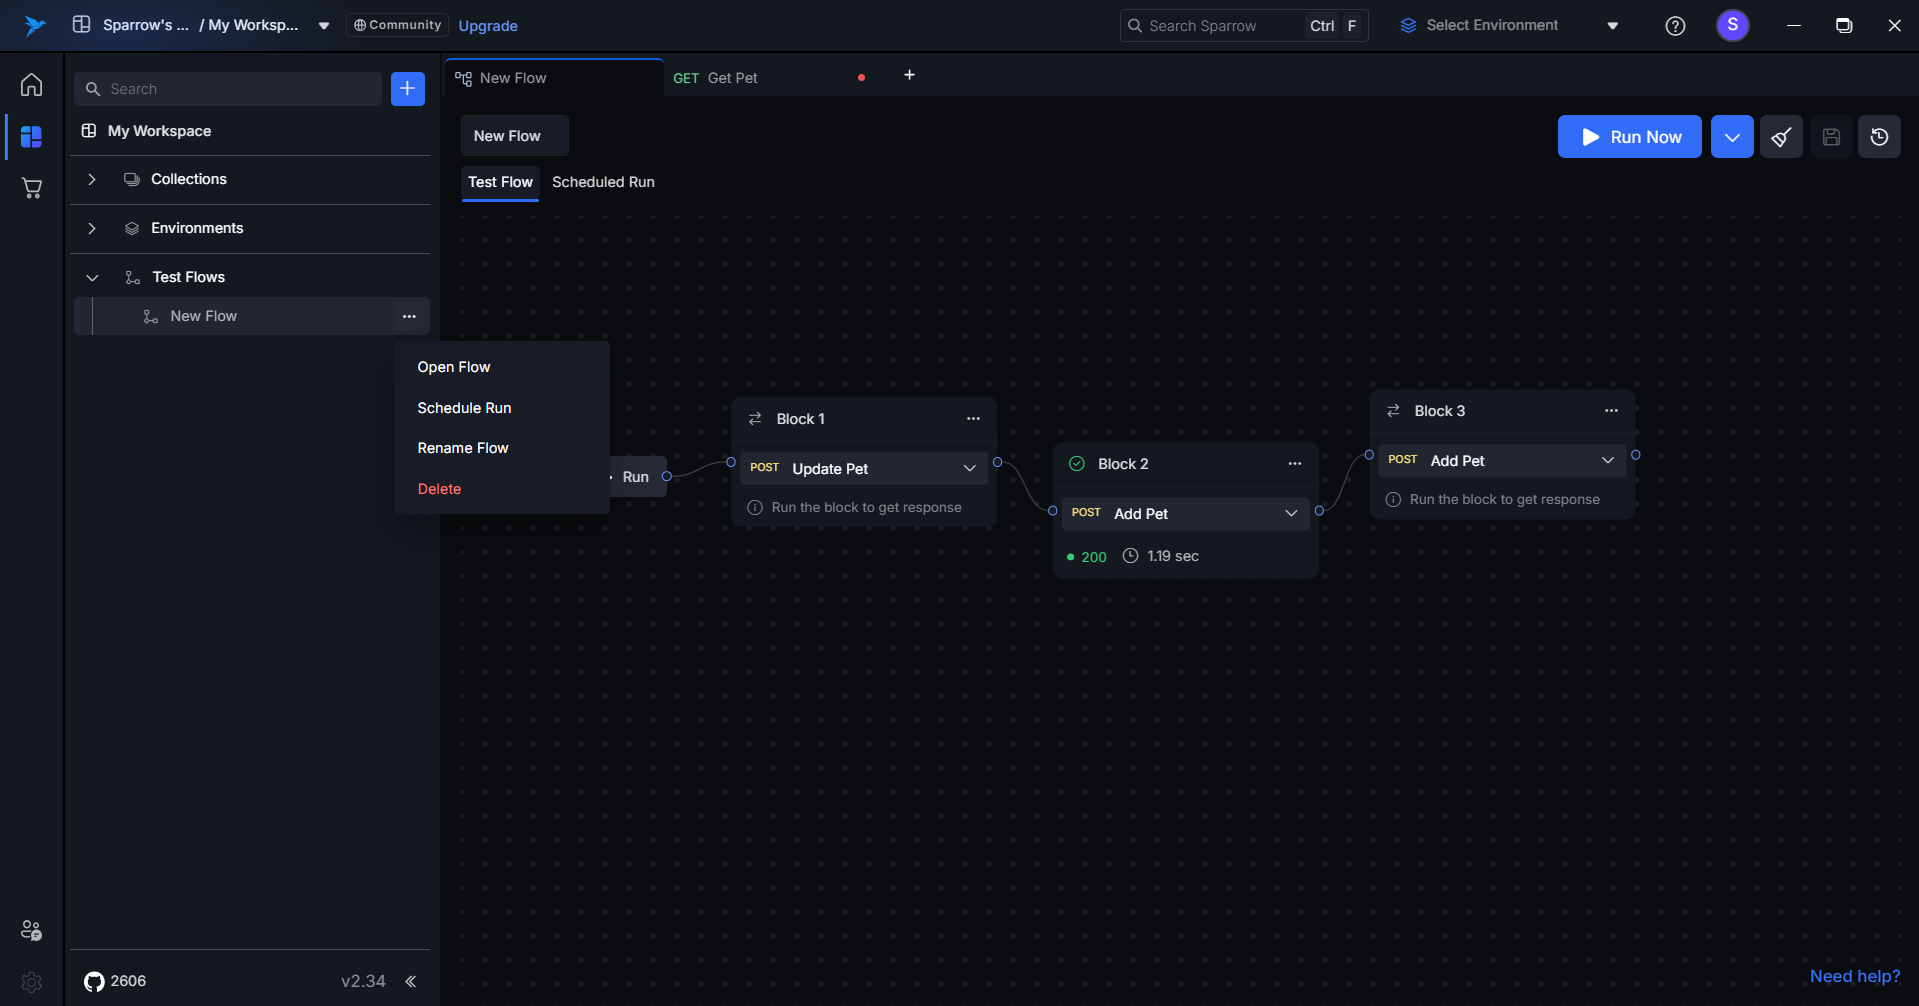
Delete the Block
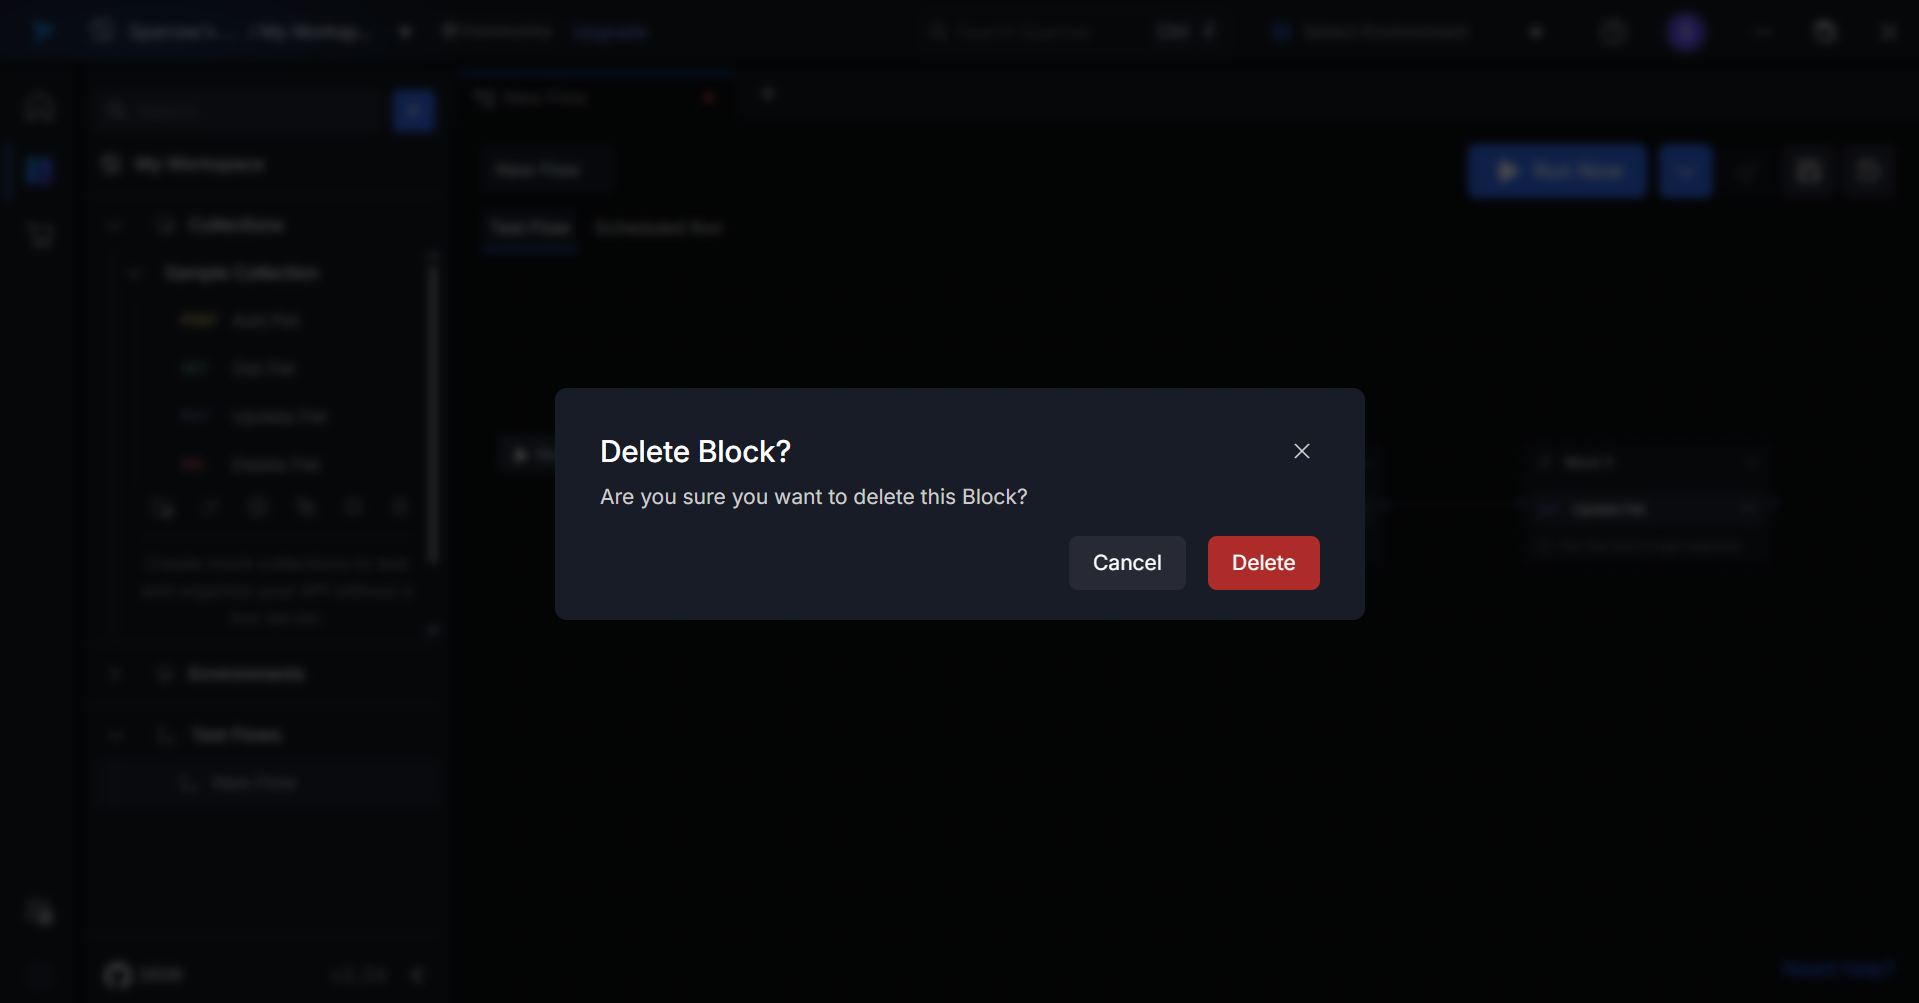
To delete a block, follow these steps:
- Click on the Three Horizontal Dots: Select the three horizontal dots present on the block that you want to delete.
- Choose the Delete Option: Click on the Delete option from the menu.
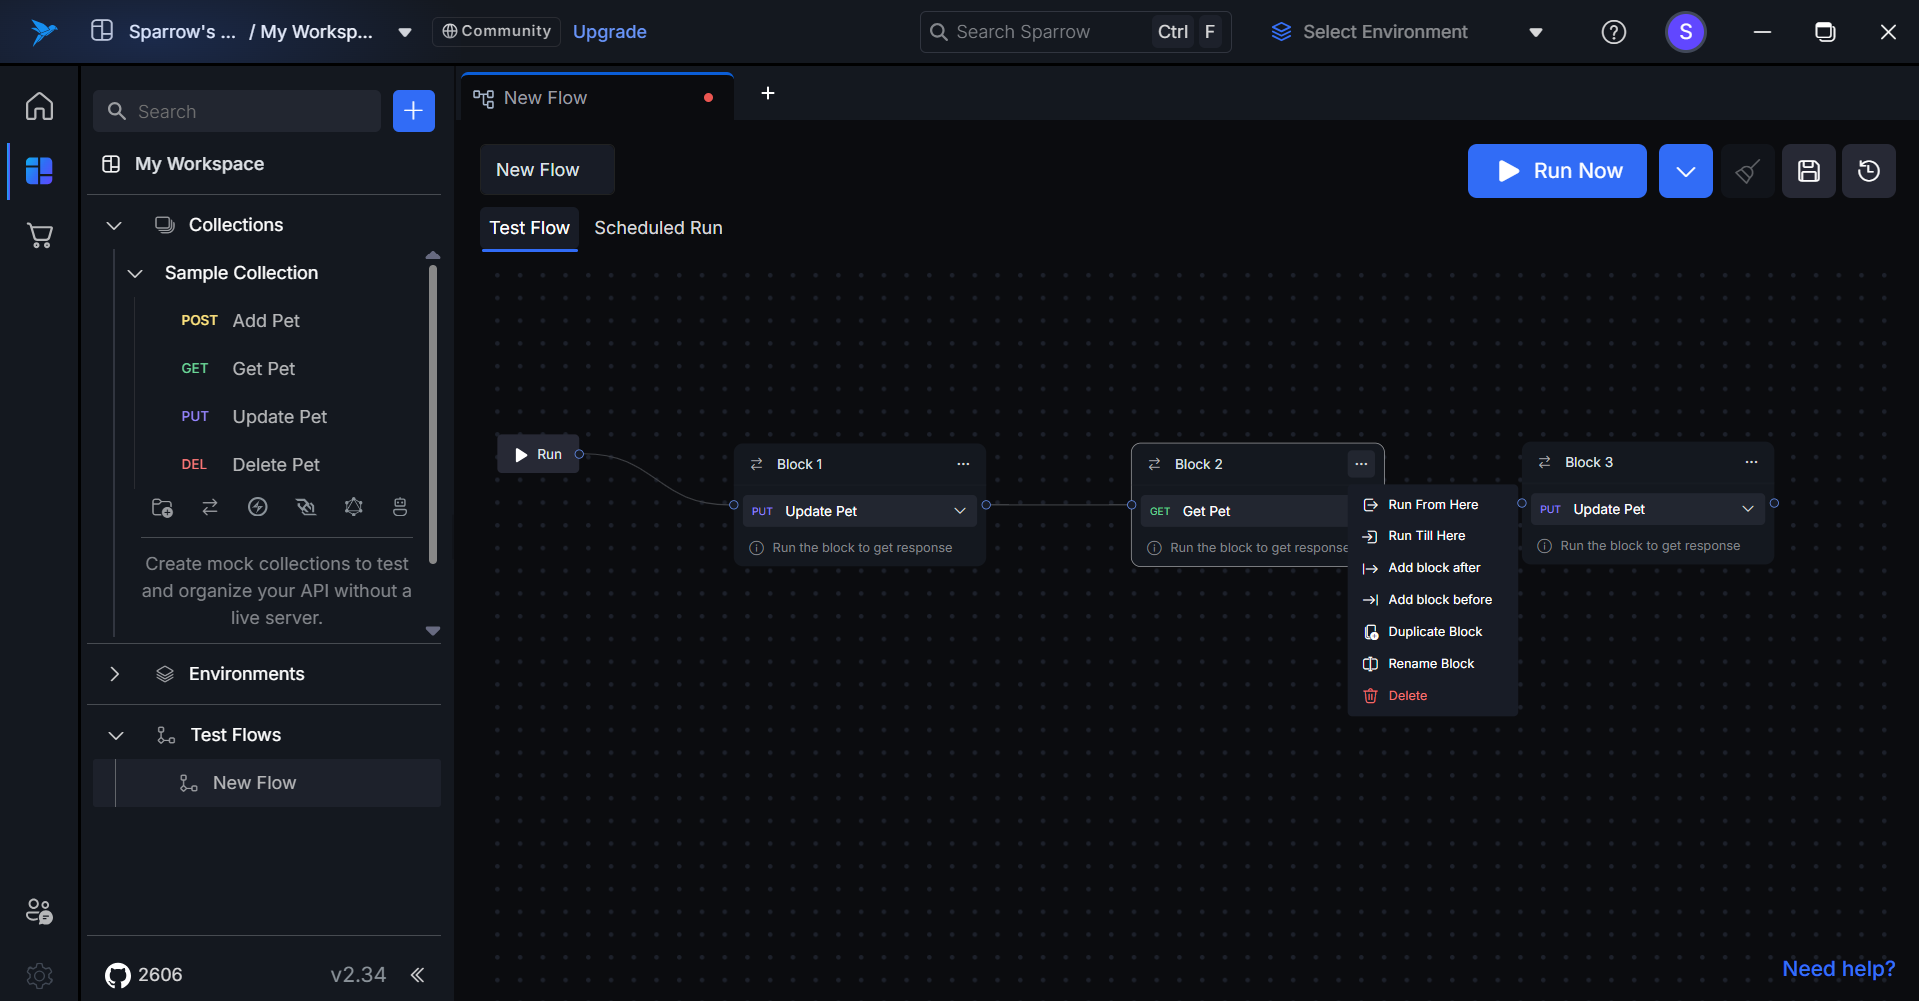
- Confirm Deletion: A delete pop-up will appear. Click on Delete to confirm your action.
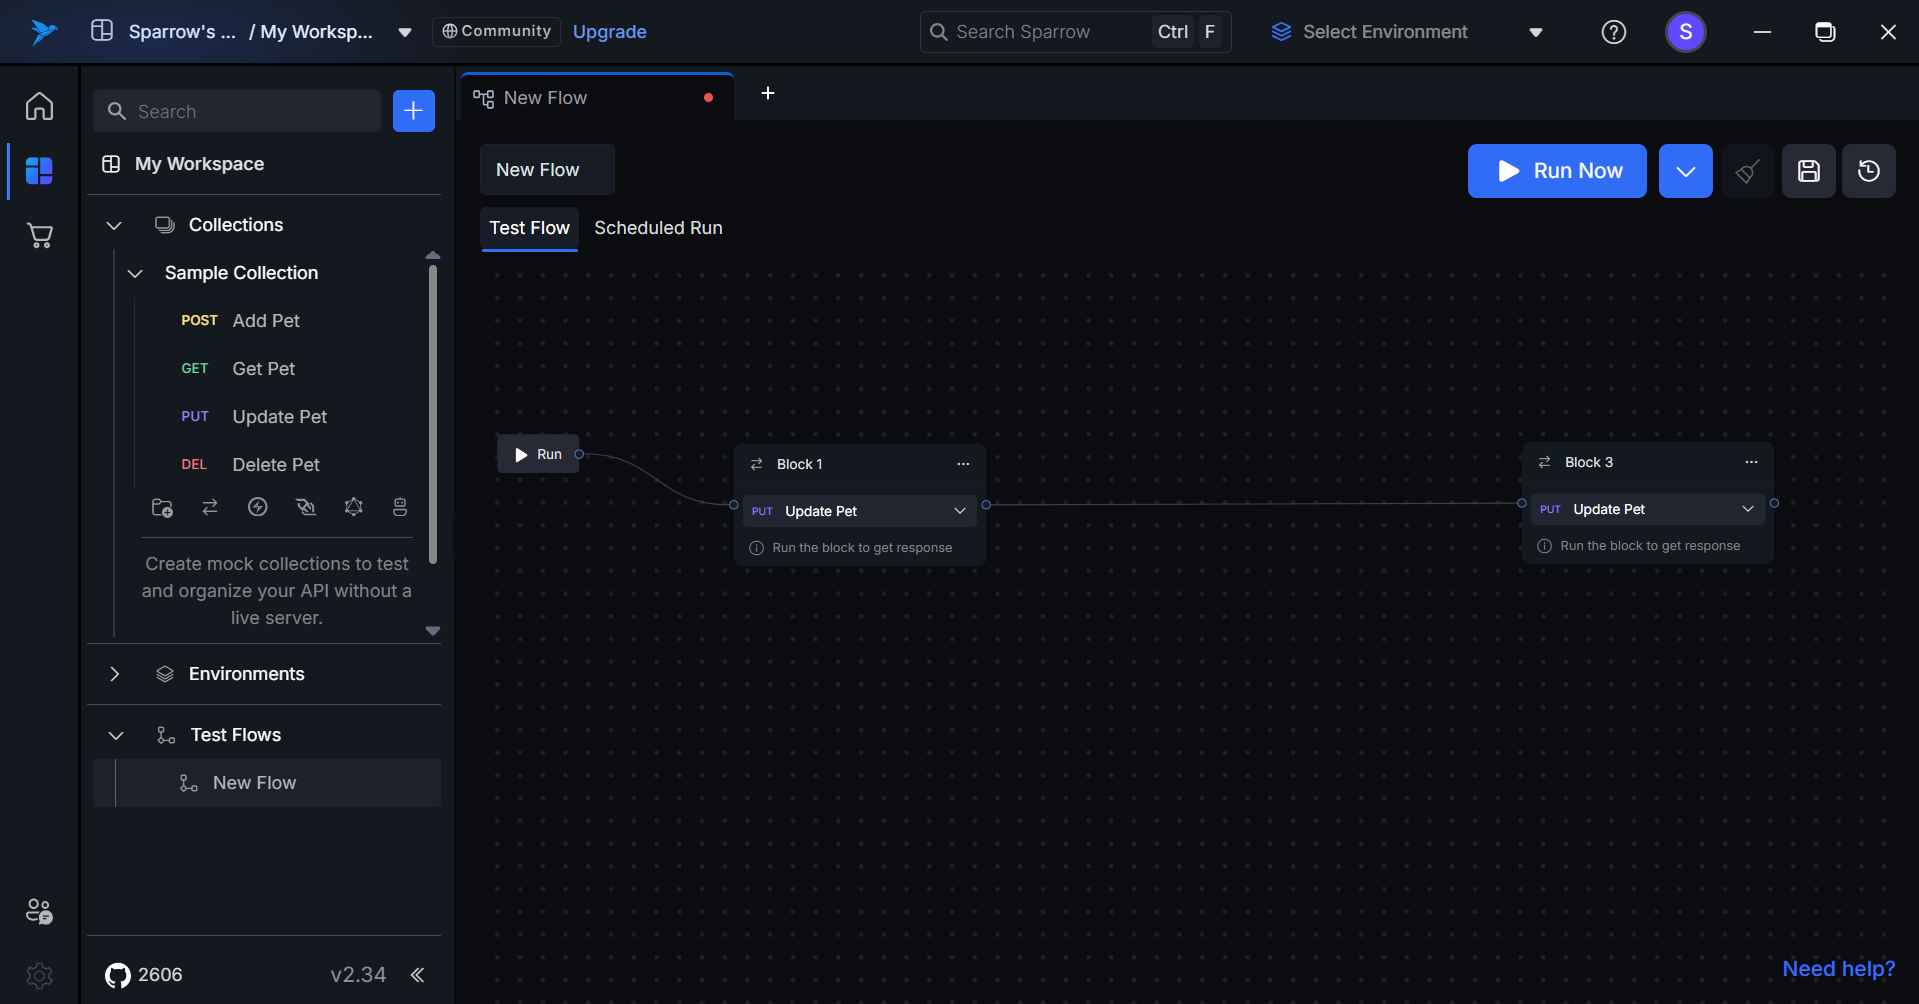
- Impact on Subsequent Blocks: If there are blocks following the deleted block, then those blocks will be connected to previous available block automatically.
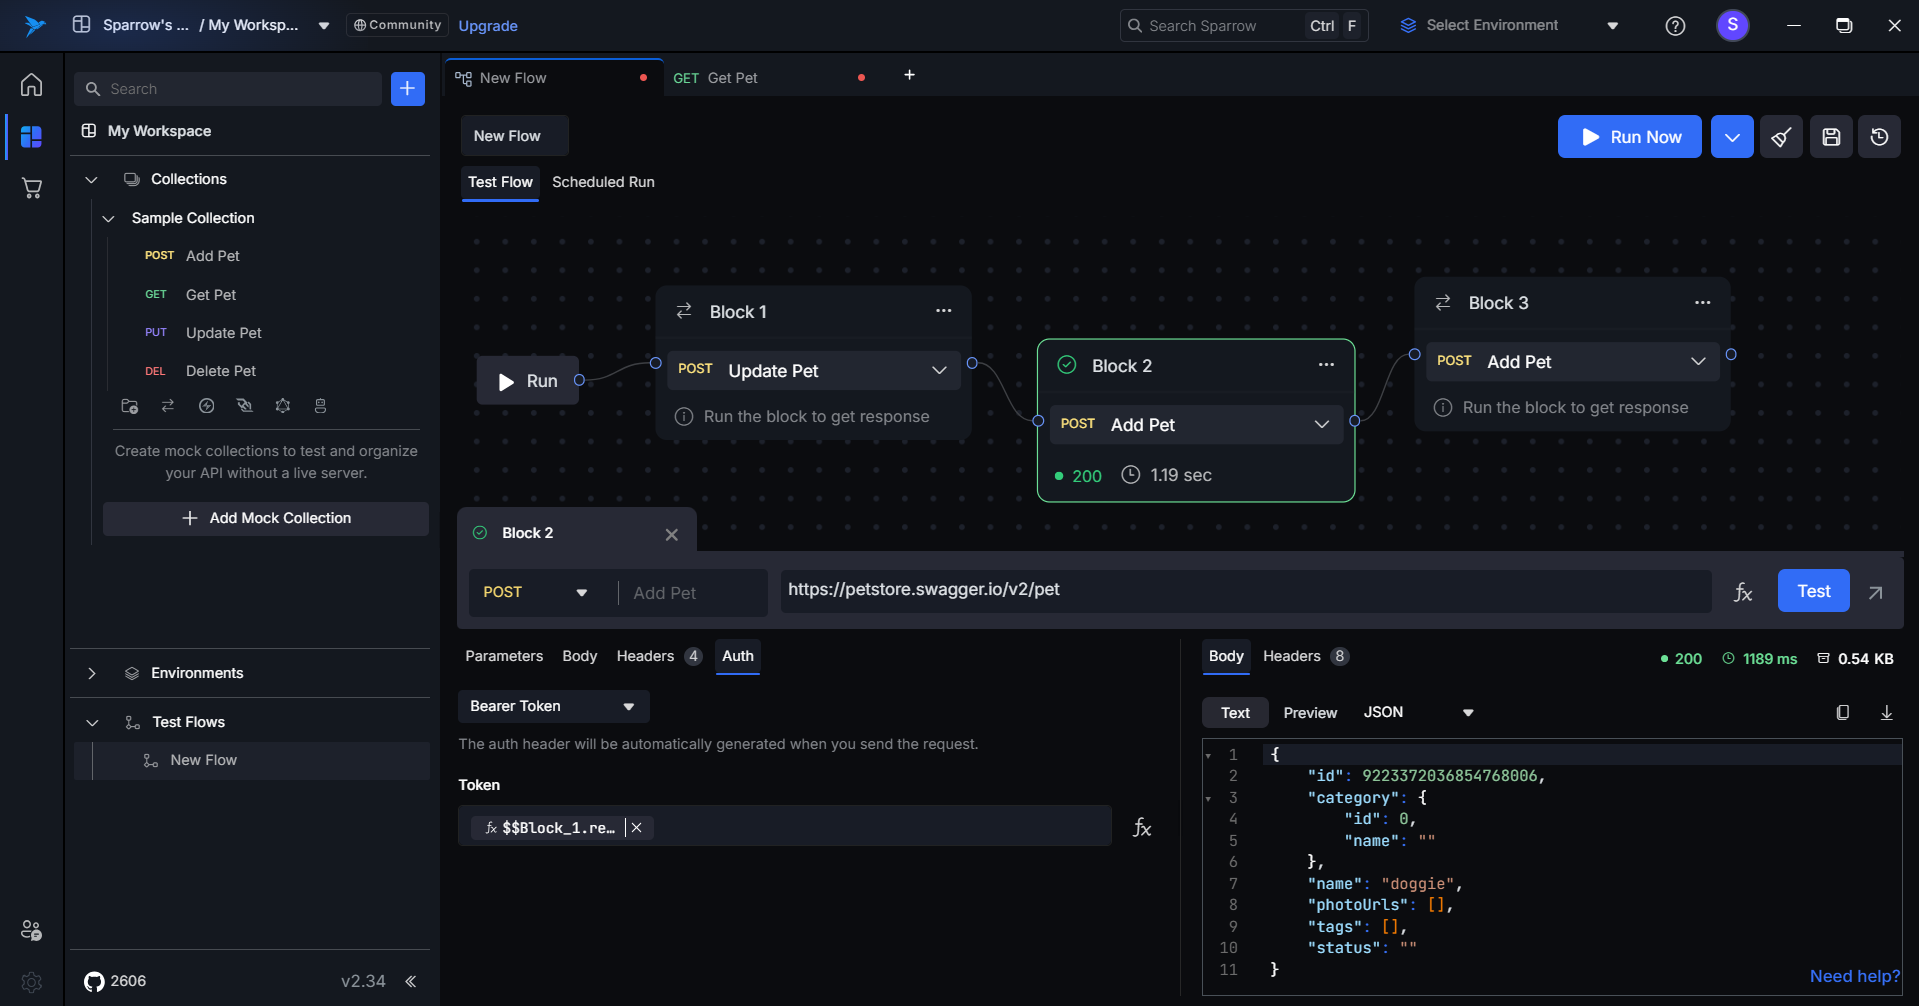
How to Execute Created Test Flows
To execute the created test flow, you can use one of the following options:
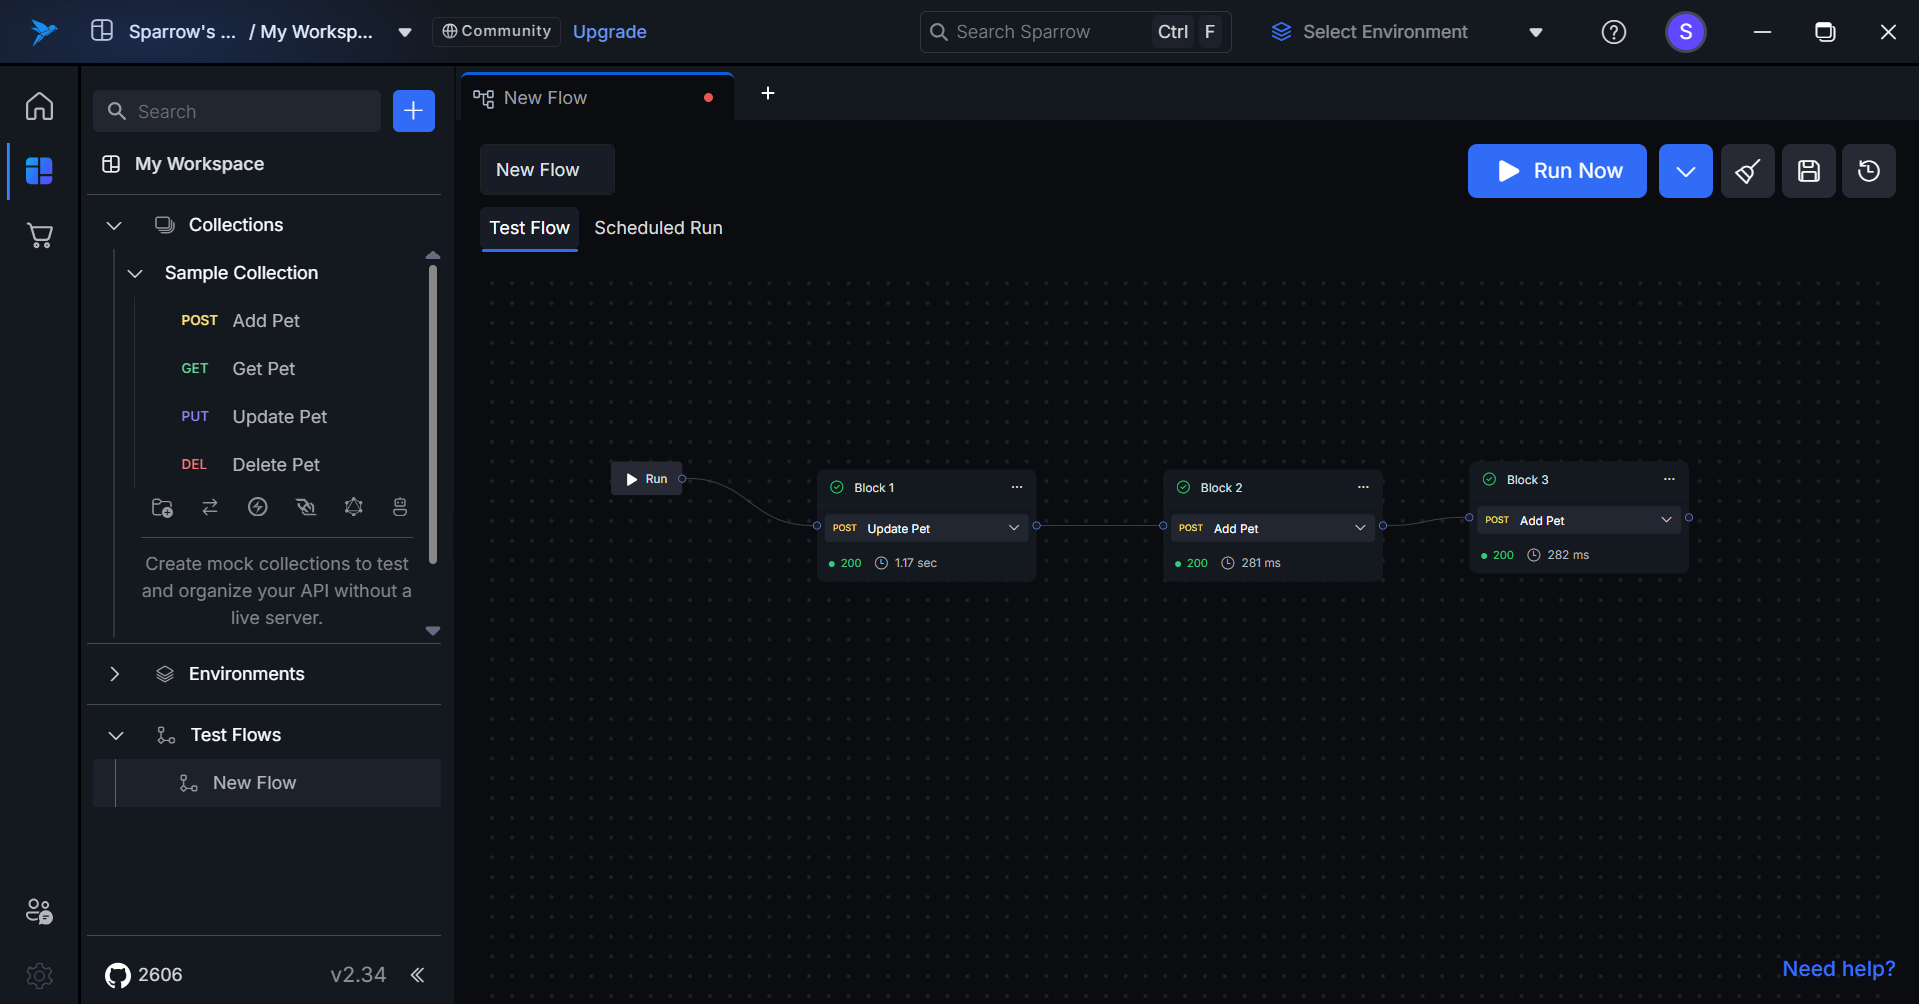
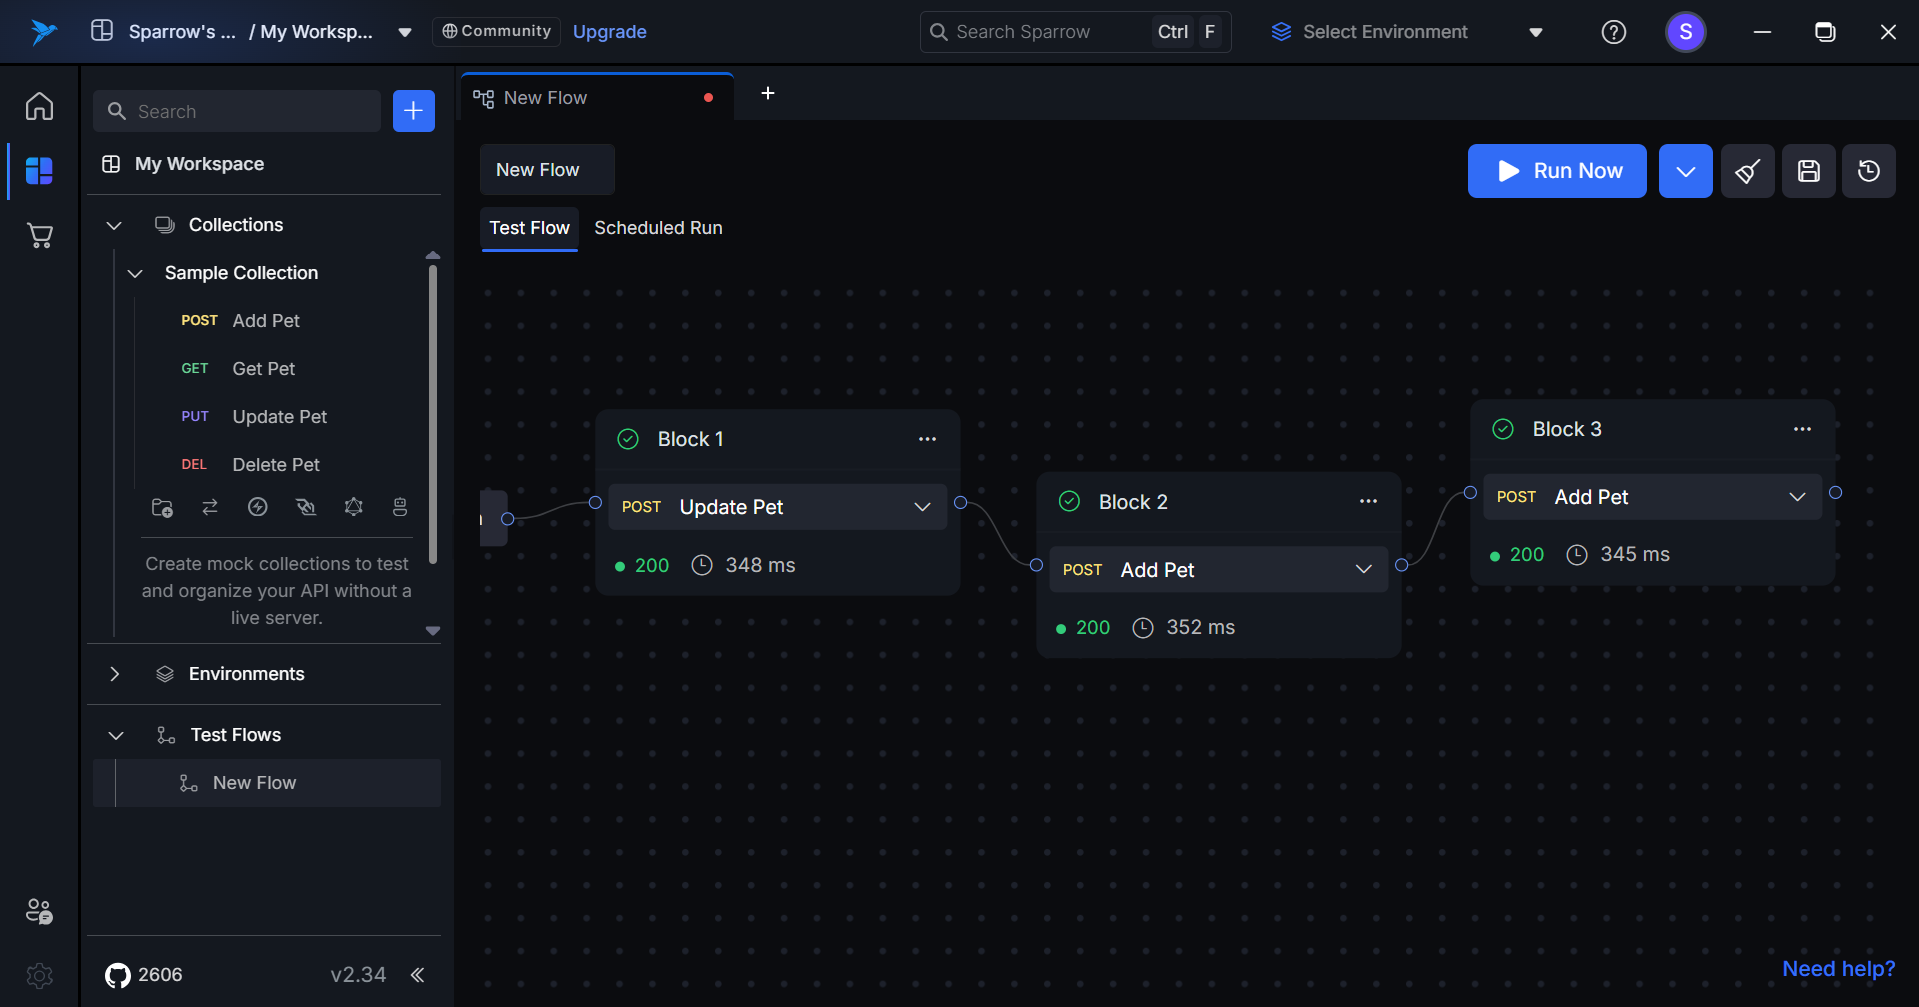
- Use the Run Button: After adding blocks to the flow, a Run button will appear in the user interface. Click on this Run button to execute the specific block within the flow.
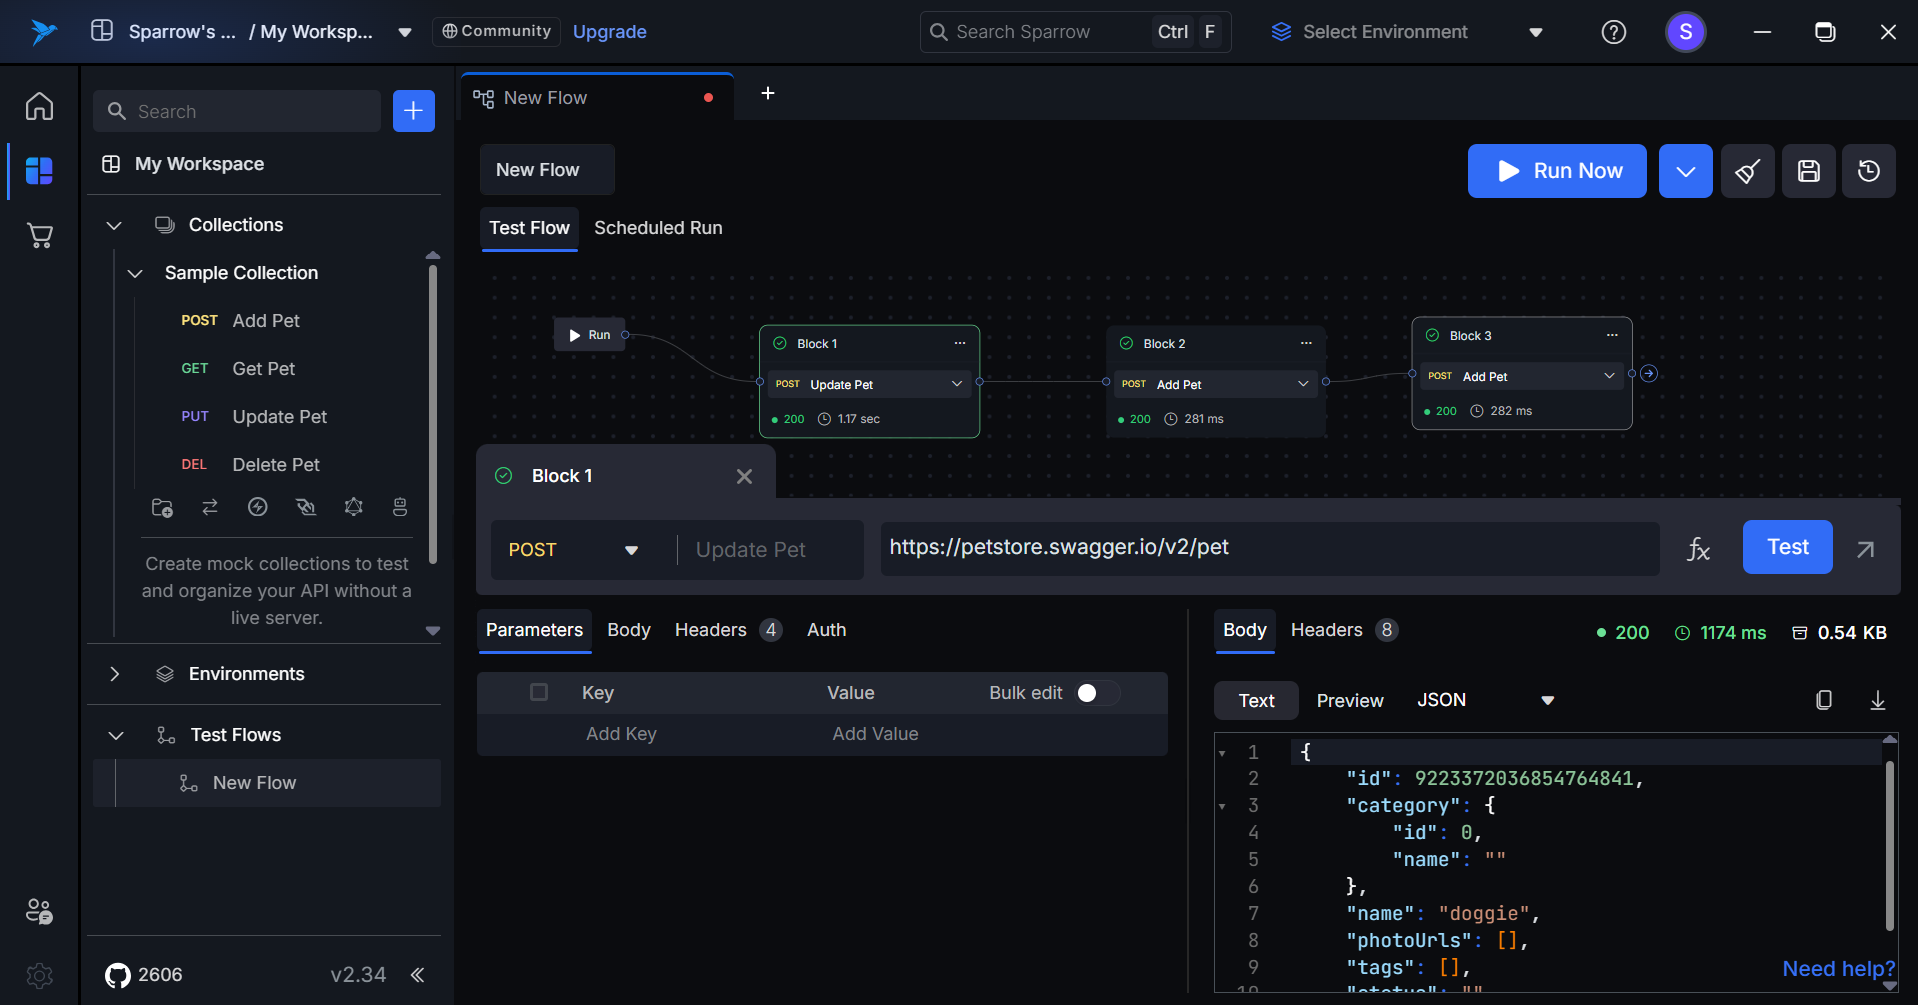
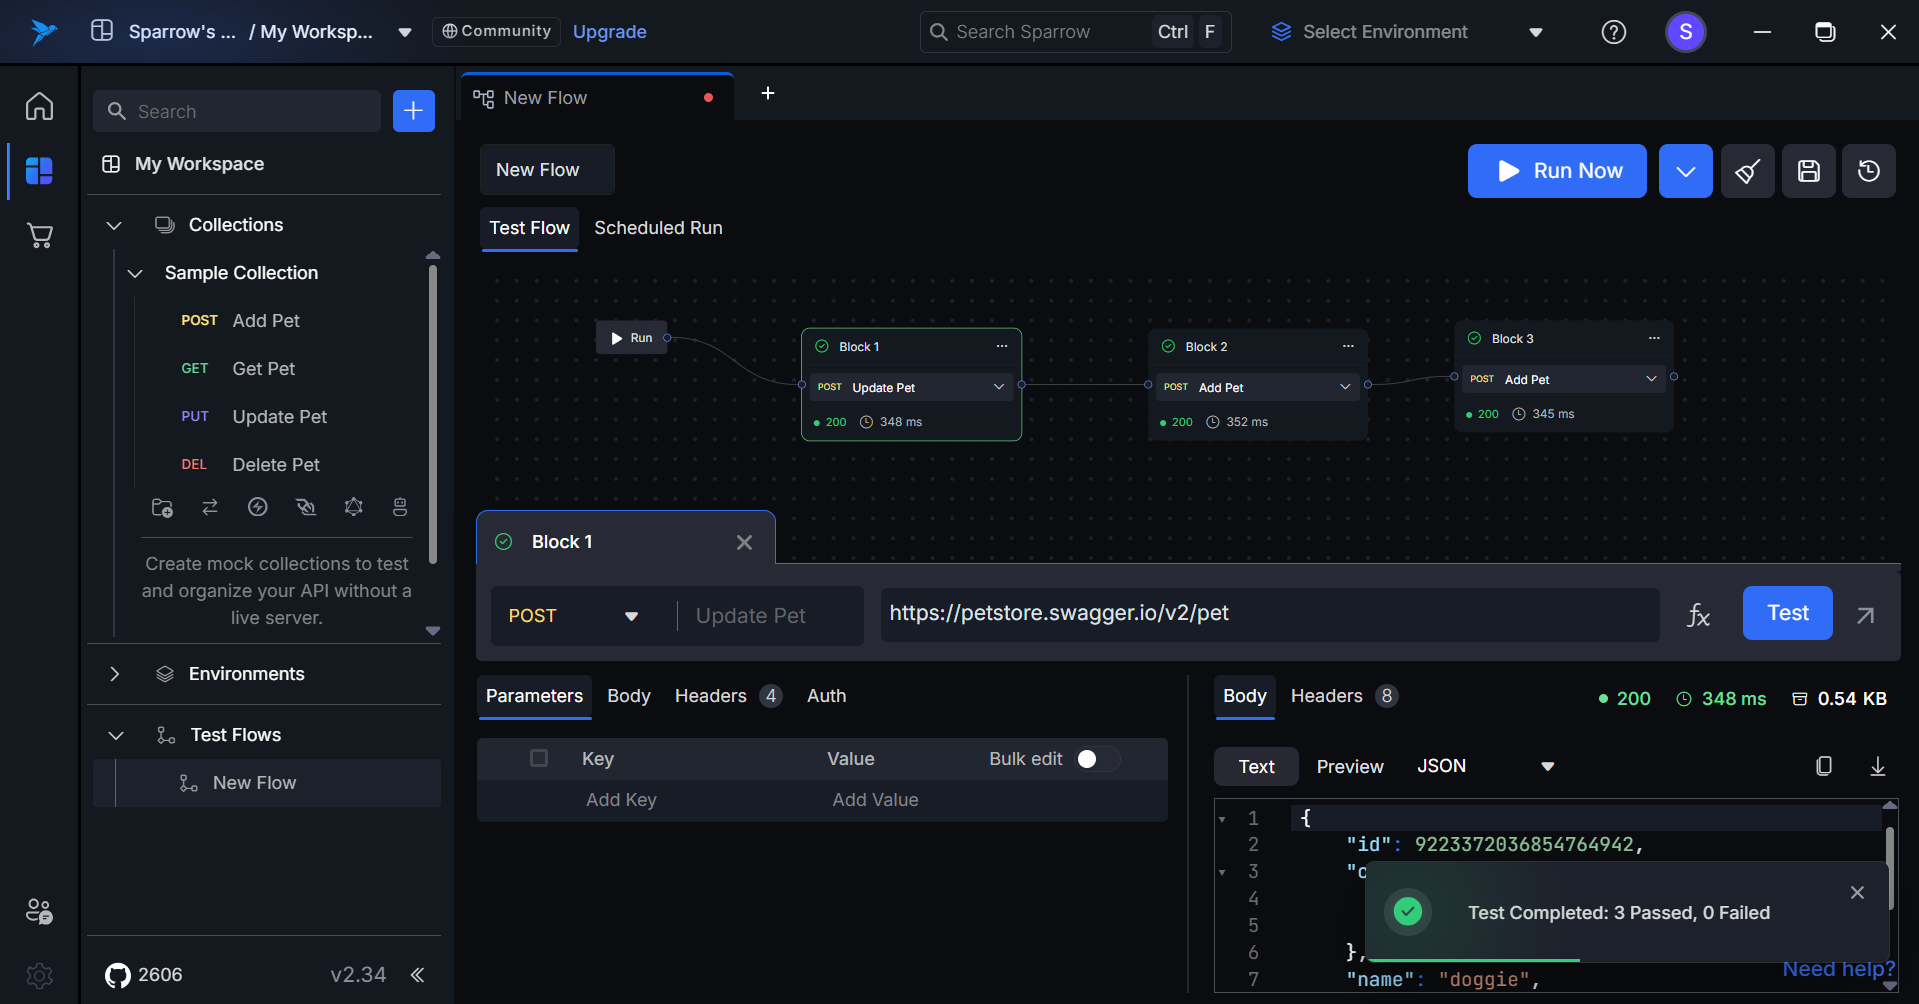
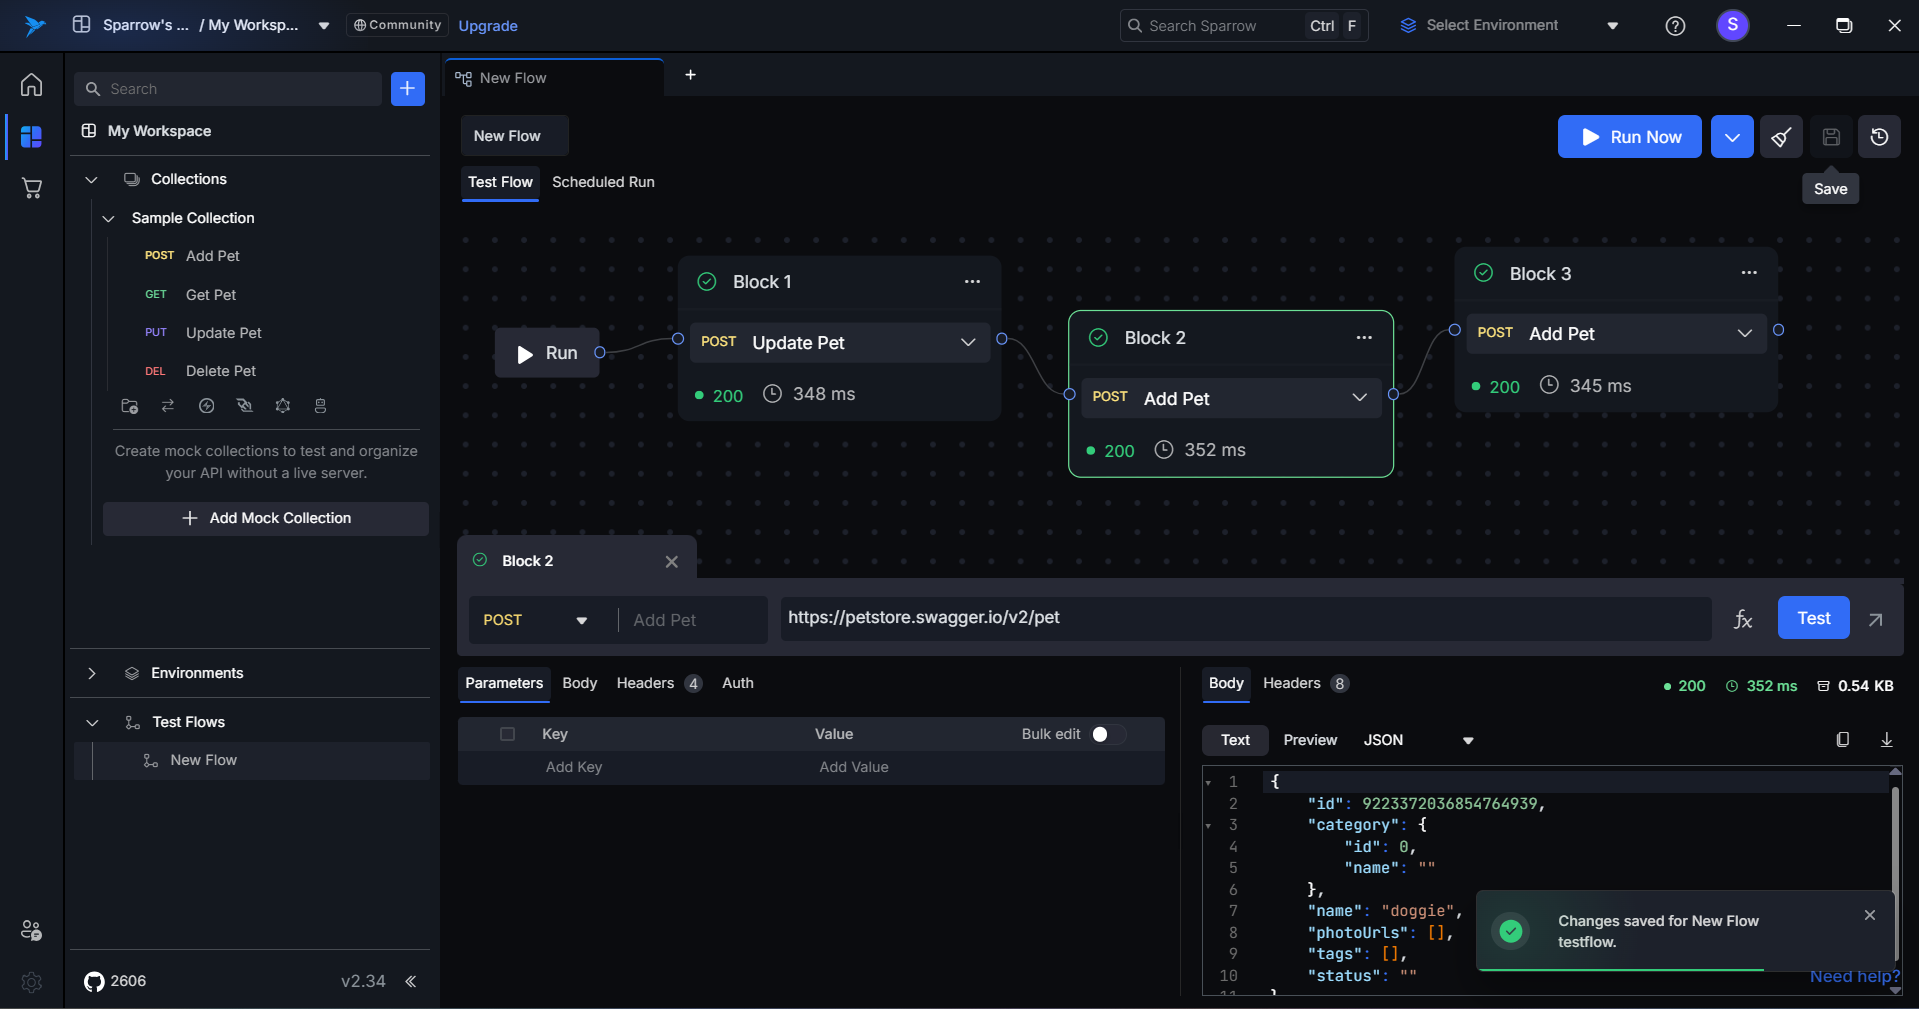
When you run the test flow, each block will execute sequentially. If the API call in a block is successful, that block will be highlighted in green, indicating a successful execution. Conversely, if the API call fails, the block will turn red, signaling an error in the execution. This color-coding helps users quickly identify the status of each step in the test flow.
Upon completion of the Test Flow execution, a toast message will be displayed, indicating the number of tests that passed and the number that failed.
How to Analyze Test Flows Results
Execution Time and Status Code
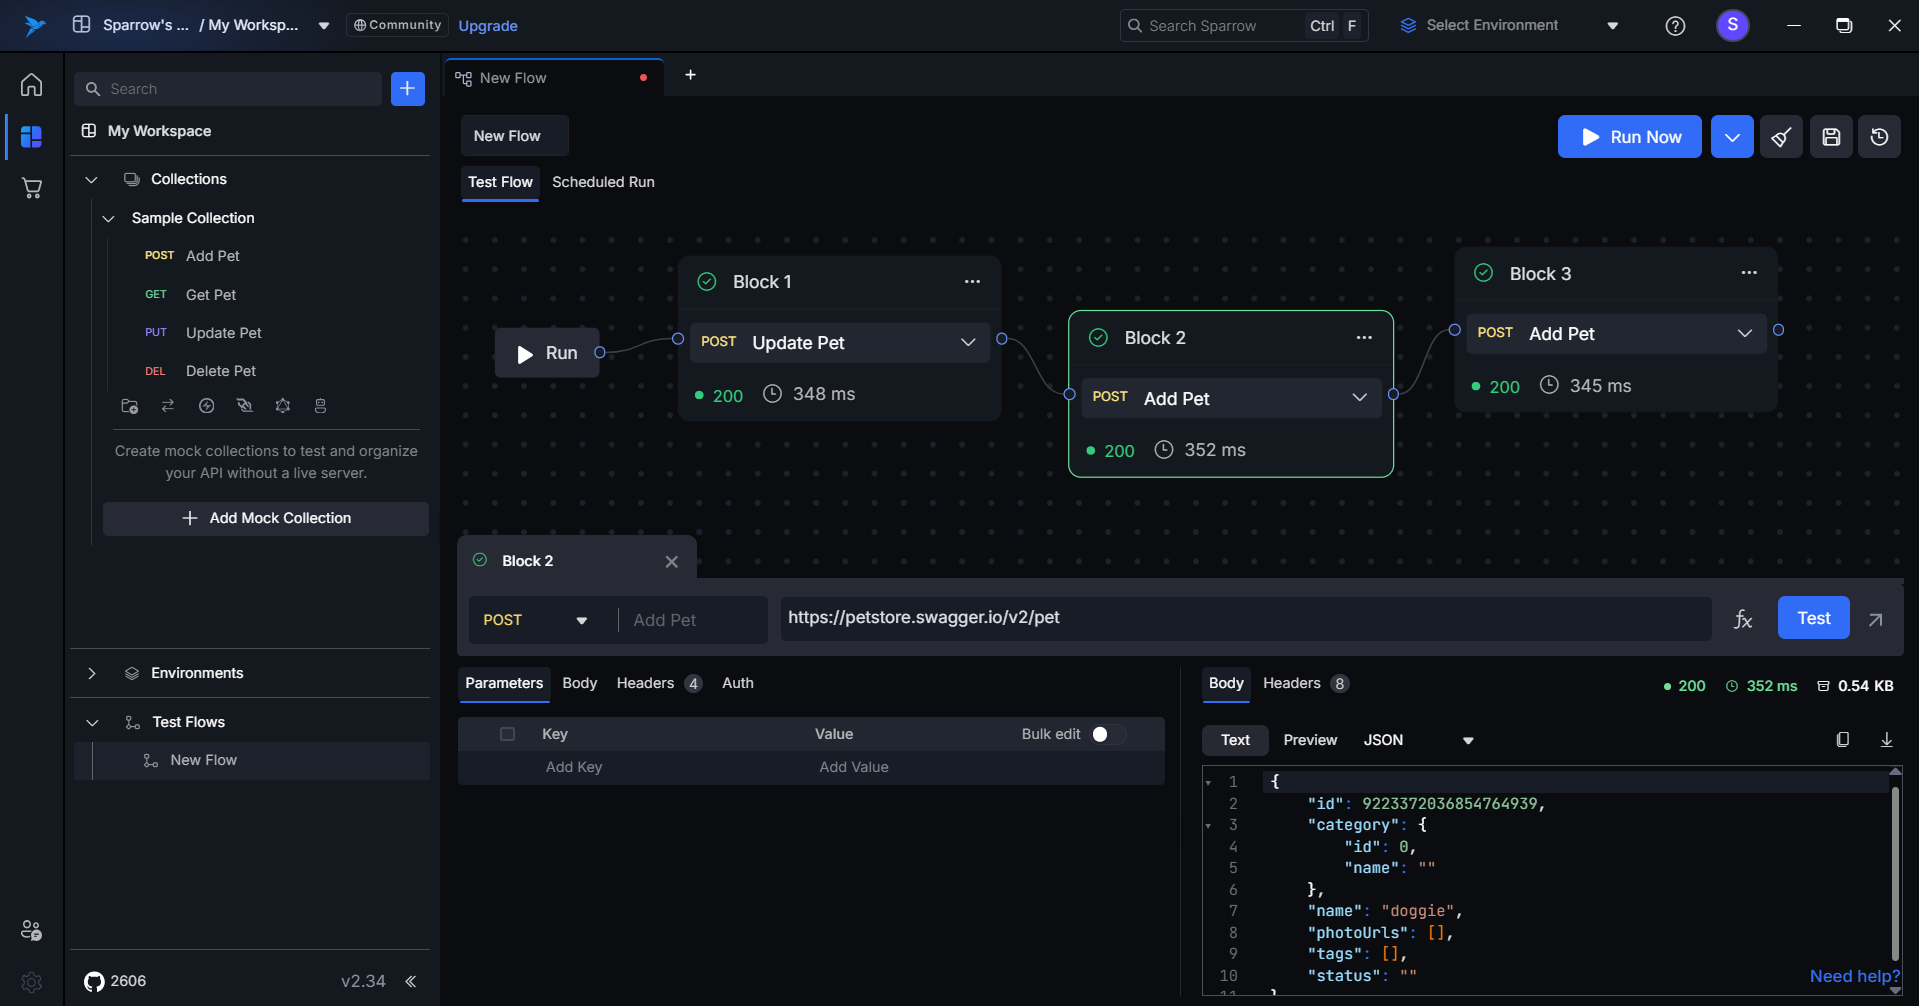
After the execution of each block, users will receive detailed information about the status code of the API call and the execution time measured in milliseconds. This data helps users assess the performance and reliability of each API request within the test flow.
Detailed Execution History
After execution, if you want to see the detailed response of a specific block, simply click on that block. This action will display the request and response details, allowing you to review the results. You will also be able to perform various operations similar to those available in a REST API tool, enhancing your ability to analyze and troubleshoot the API interactions.
How to View the Test Flows History
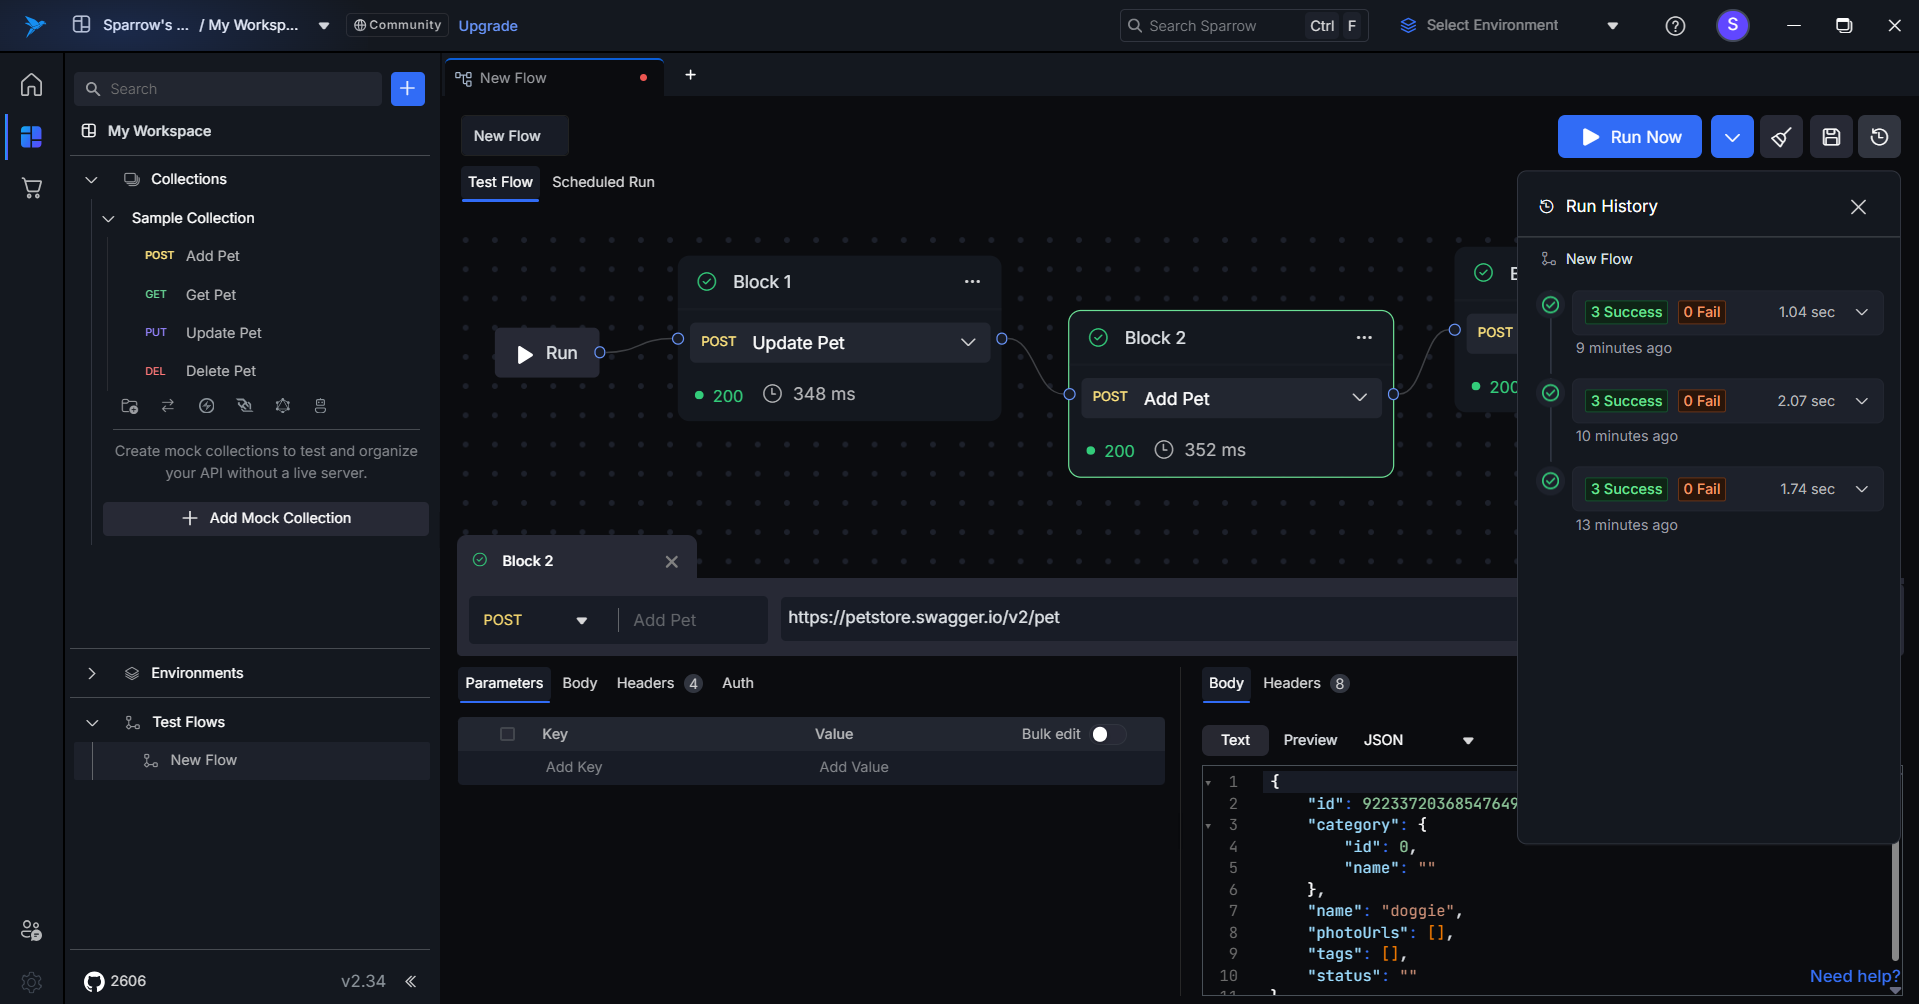
To view the previous execution history, simply click on the See History button located in the top right corner. The history will then open below, displaying all previous execution details.
How to Save the Test Flows
To save the test flow, click on the Save button located in the top right corner. A success toast message will appear once the test flow is saved, confirming the action. You will then be able to see the saved flow in the left-hand side panel under Test Flows.
Dynamic Expressions in Sparrow
Dynamic expressions in Sparrow allow you to seamlessly chain multiple API requests by referencing and extracting data from previous API responses. This is especially useful when working with multi-step workflows where one request’s output becomes another request’s input.
Where You Can Use Dynamic Expressions
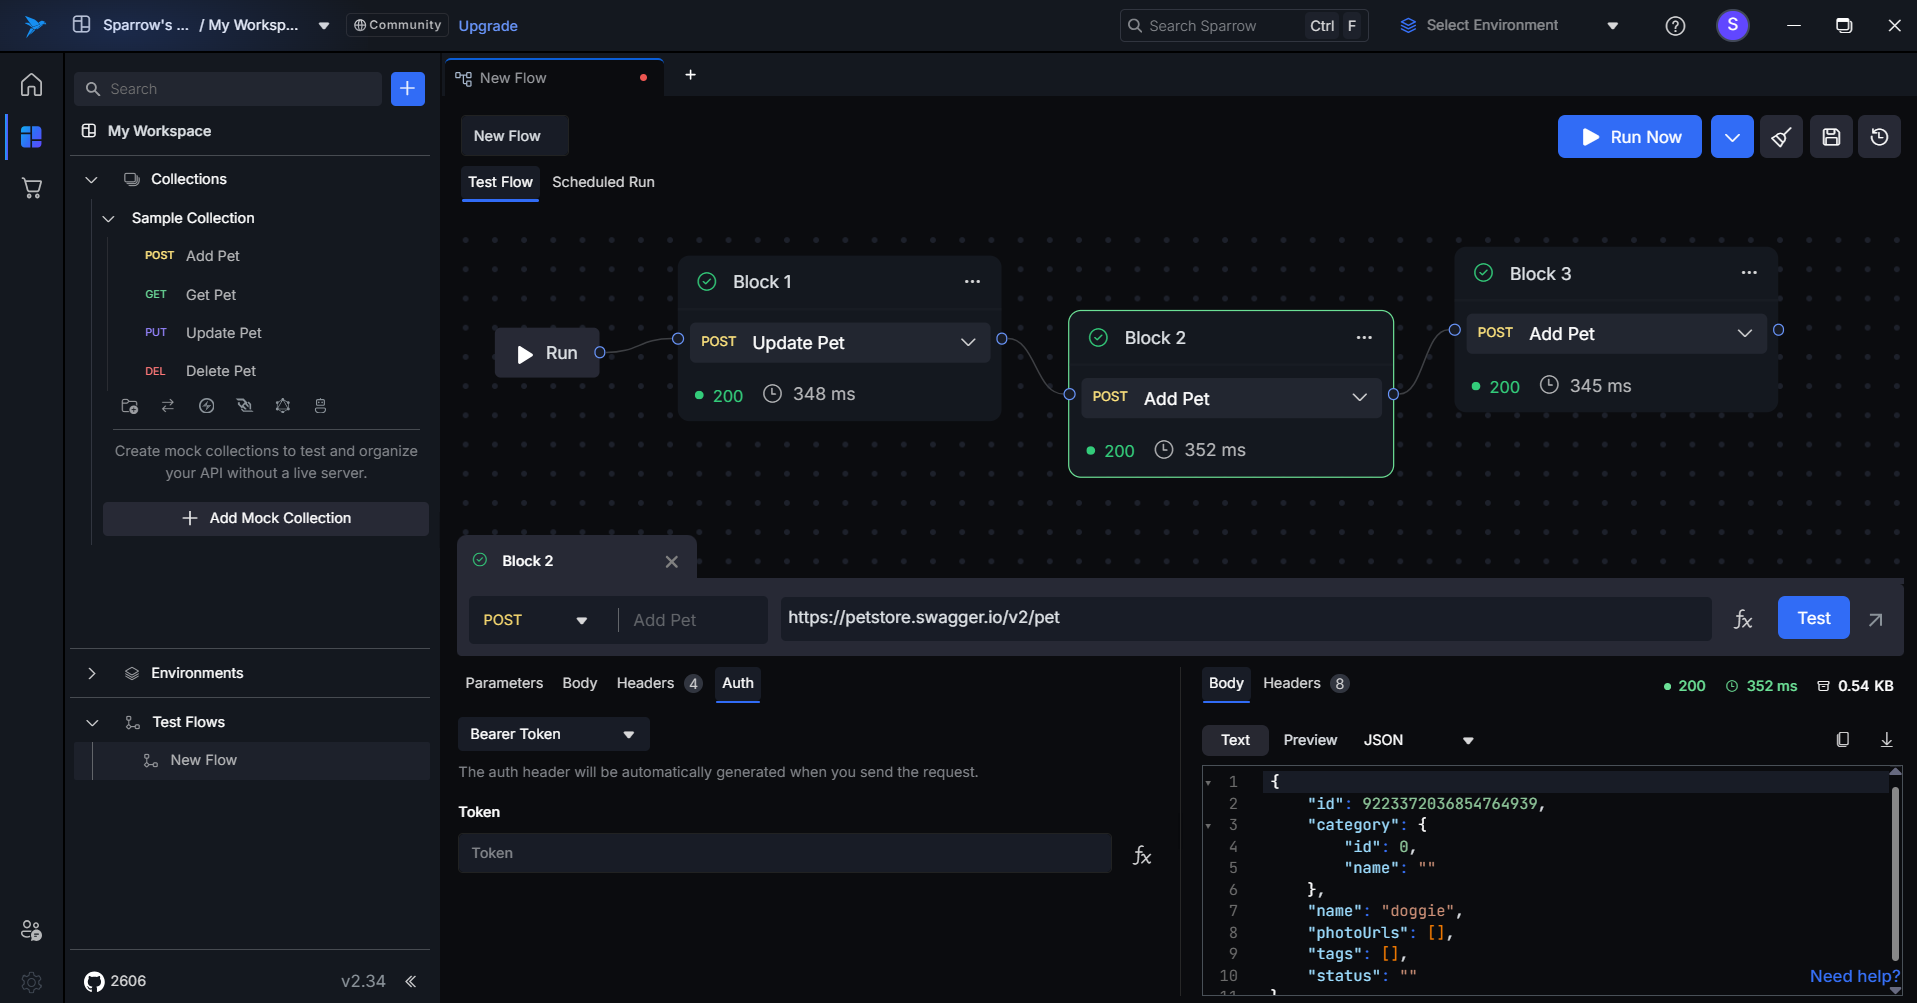
Dynamic expressions can be inserted into nearly any part of your API request:
URL, Query Parameters, Headers, Body, and Auth.
These expressions dynamically pull values from previously executed API blocks, making your requests context-aware and reducing manual effort.
Getting Started with Dynamic Expressions
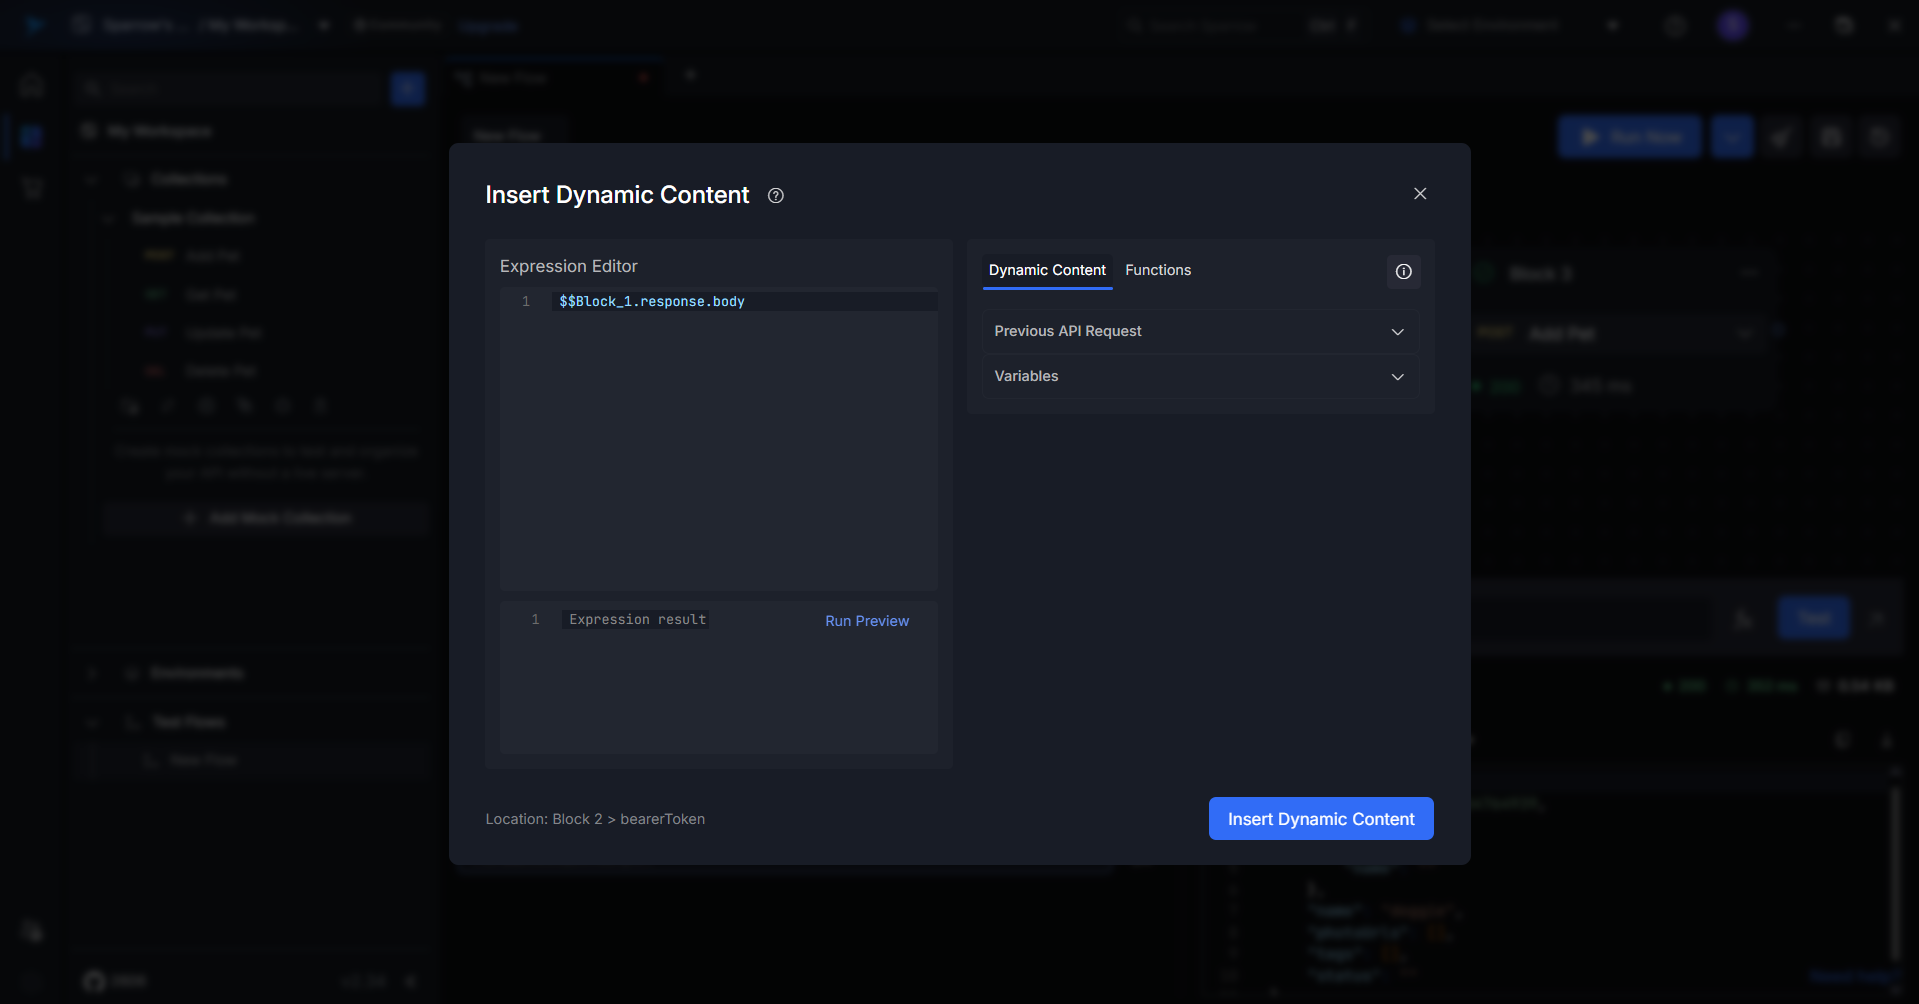
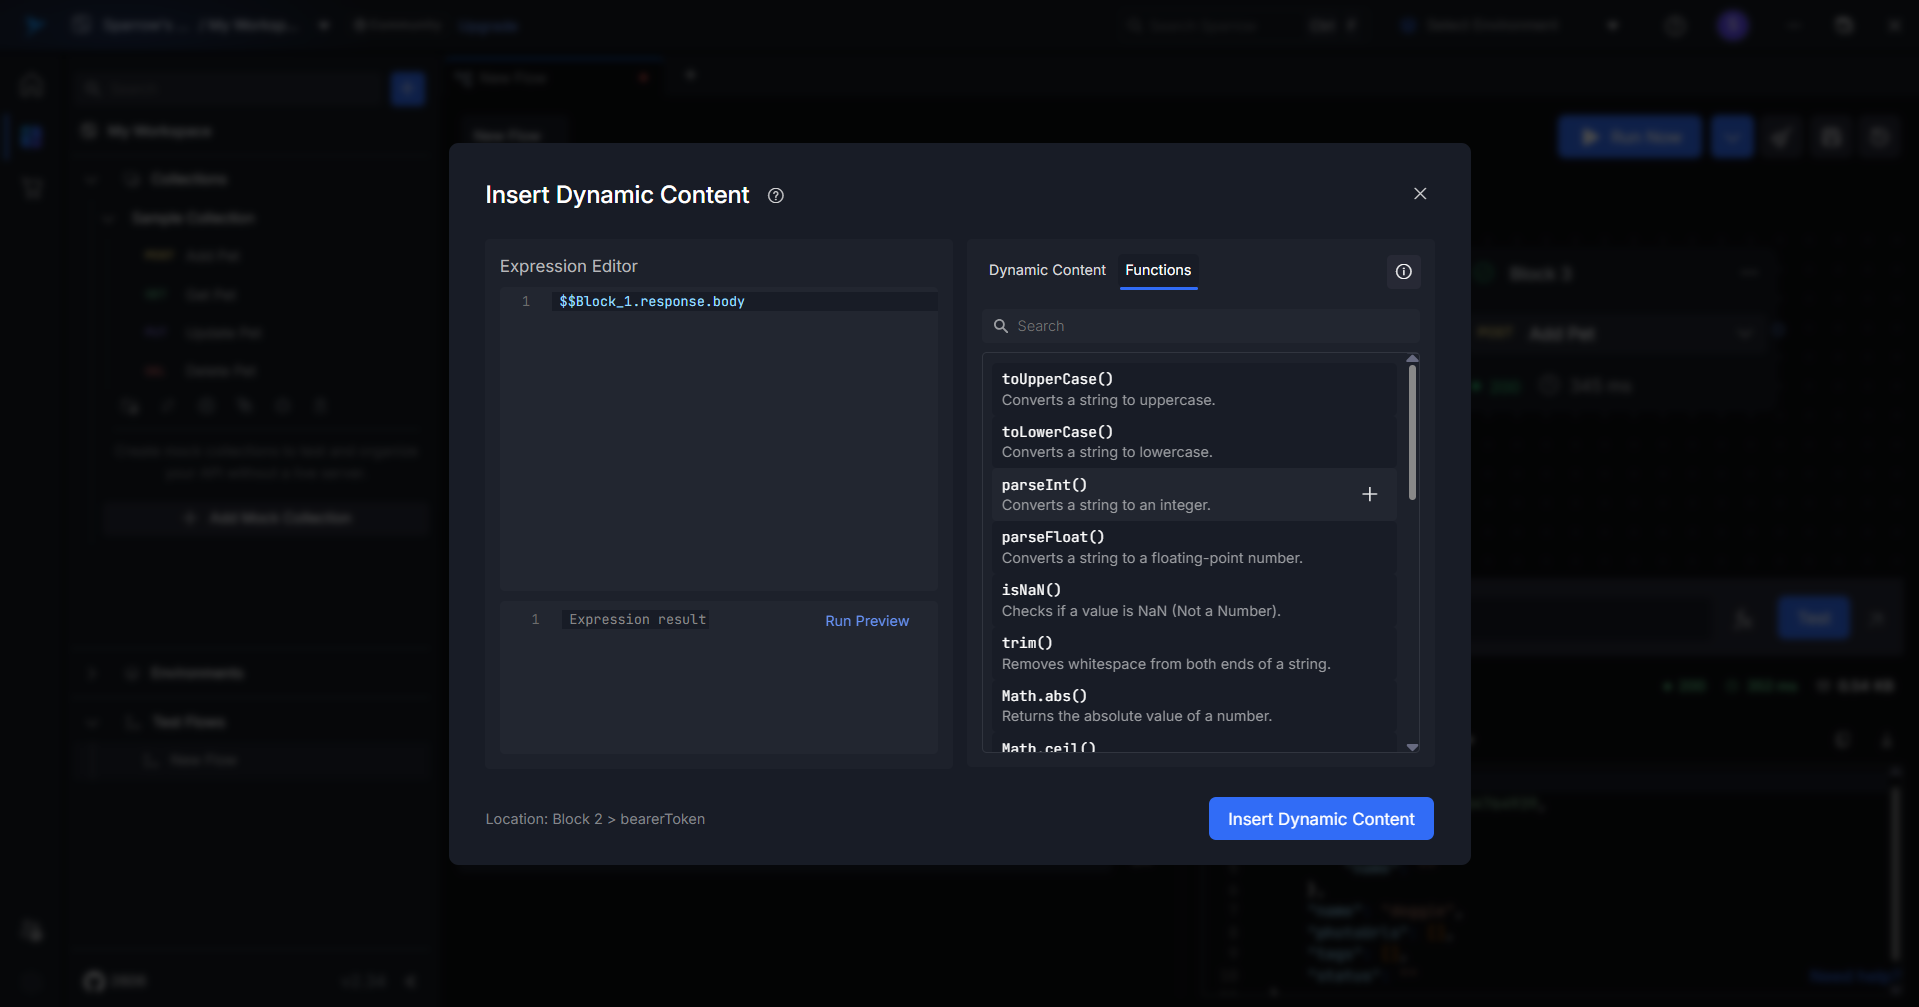
Step 1: Locate and Click the fx Button
- In any editable field (URL, headers, body, etc.), click on the fx icon.
- This opens the Insert Dynamic Content Modal, where you can craft expressions or insert dynamic values from previous responses.
Step 2: Expression Editor
The Expression Editor allows you to use JavaScript-like syntax to build complex dynamic values.
Example:
$$ Block_1.response.body.data.accessToken.token + " - Updated"
This example extracts the accessToken field from the response of Block 1, then appends " - Updated" to it.
You can use string manipulation, math operations, conditionals, and more in this editor.
Step 3: Insert Dynamic Content
Within the Dynamic Content tab of the modal:
- Navigate through your previous API blocks.
- Select a specific field to inject into the current request.
This inserts placeholders like: $$Block_1.response.body.data.accessToken.token
You can also use:
- Environment Variables for dynamic configurations.
- Global Variables shared across all flows.
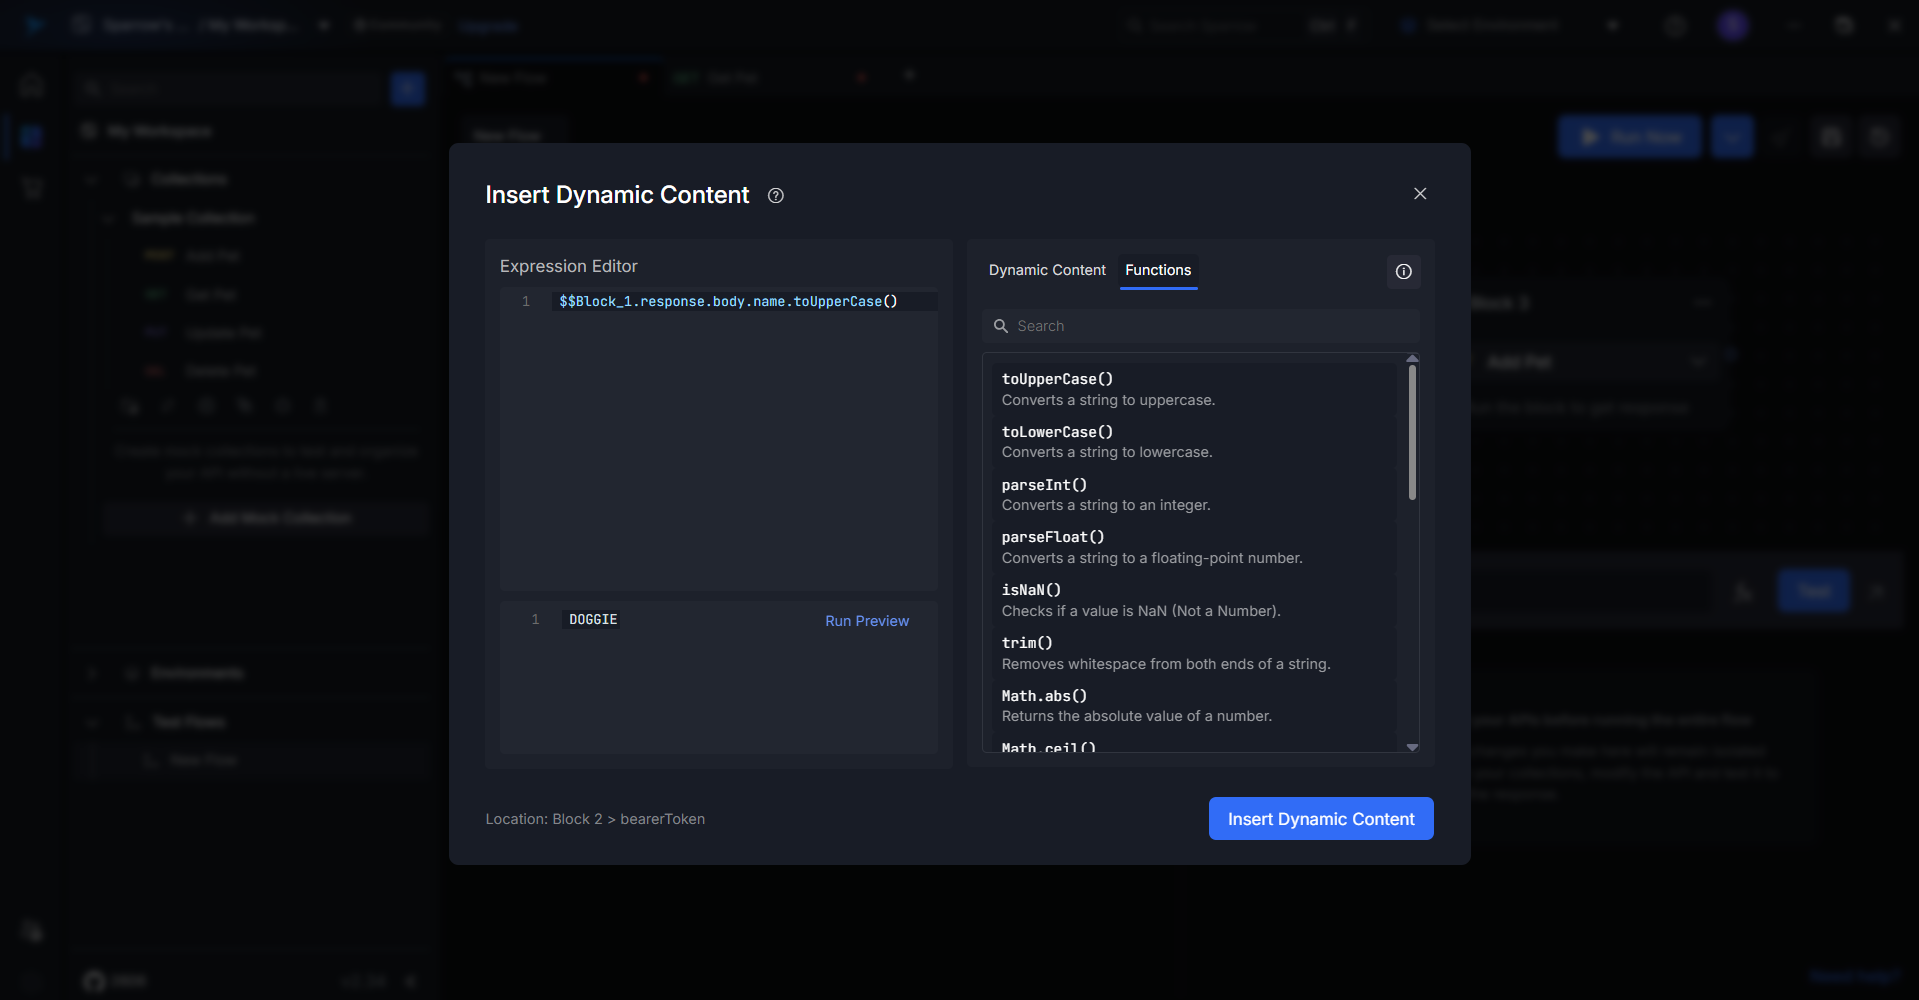
Step 4: Use Built-in Functions
The Functions tab includes useful helpers to manipulate strings, numbers, and other types of data.
| Function | Description Example
| toUpperCase() | Converts string to uppercase | toUpperCase("hello") → "HELLO" |
| trim() | Removes leading/trailing whitespace | trim(" test ") → "test" |
| parseInt() | Converts a string to integer | parseInt("42") → 42 |
| Math.random() | Returns a float between 0 and 1 | Math.floor(Math.random() * 10)
Combined Example:
$$Block_1.response.body.data.accessToken.token.toUpperCase()
This convert the Block 1 access token to uppercase.
Step 5: Run Preview
Before inserting the expression:
- Click the Run Preview button.
- This lets you evaluate the result of your expression in real-time.
- Confirm correctness and ensure no runtime errors or undefined values.
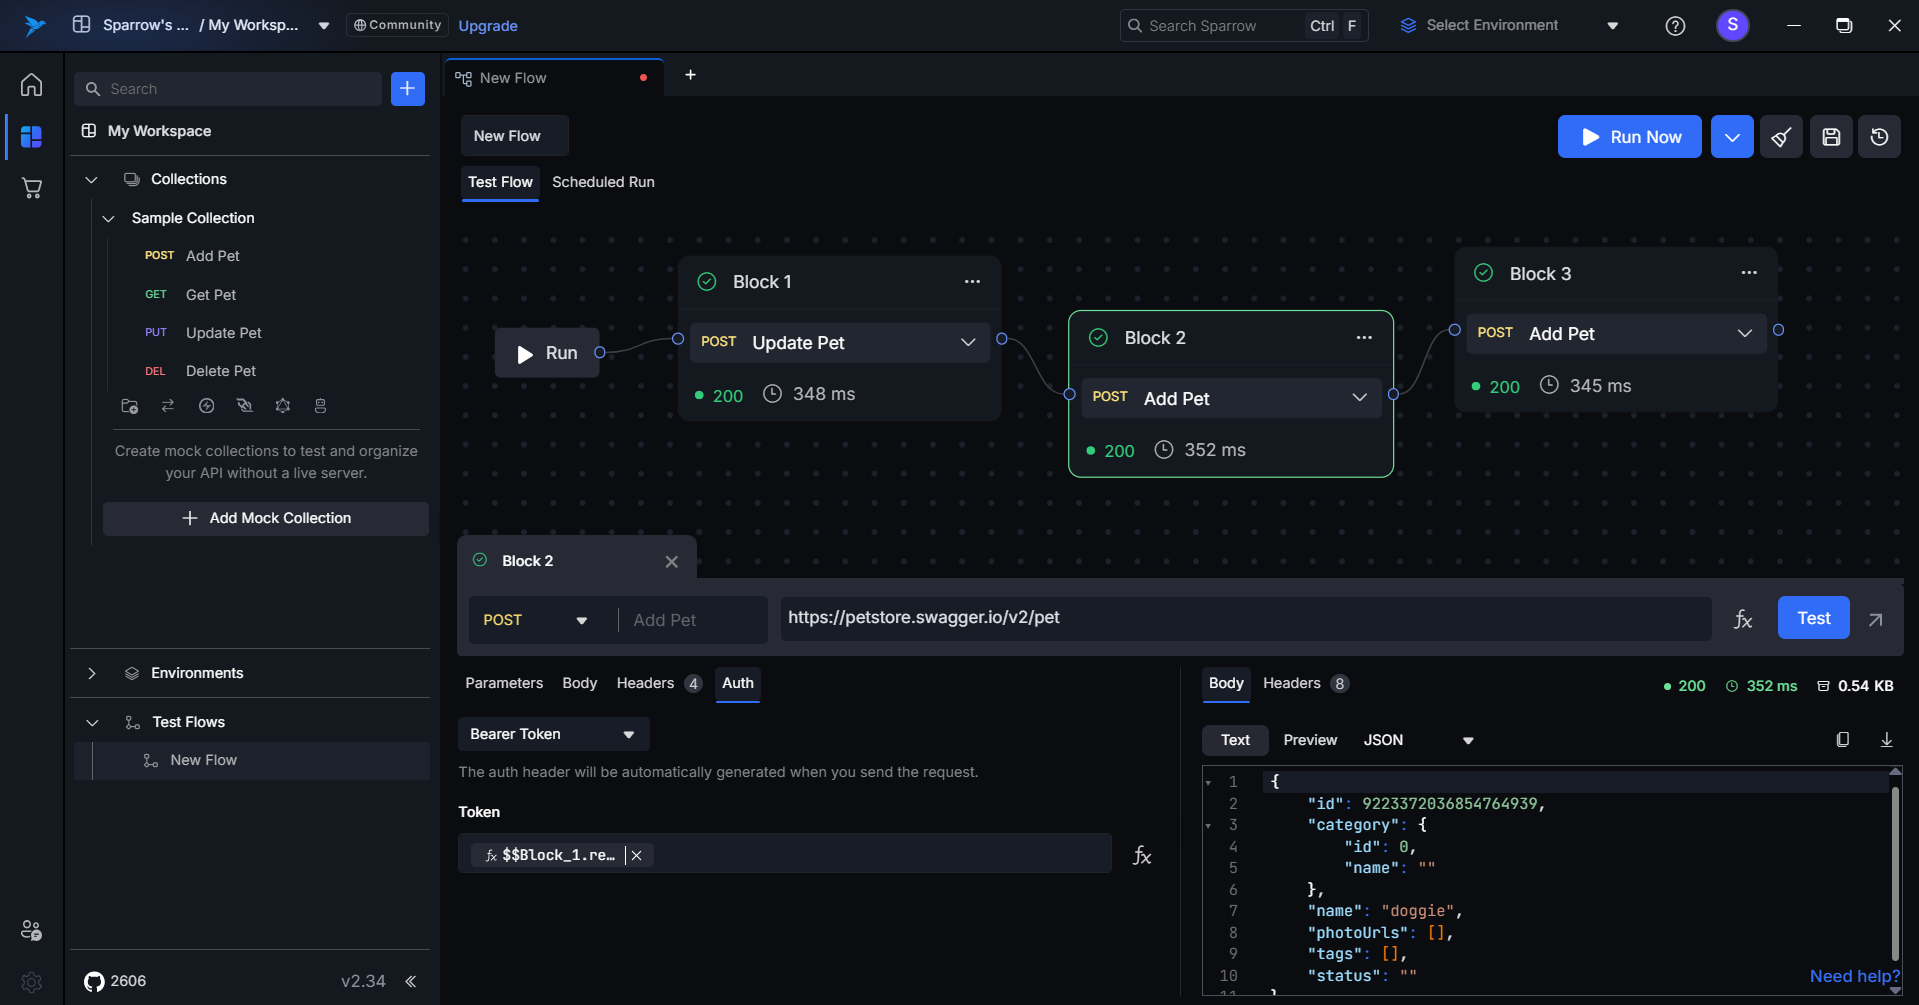
Step 6: Insert into Request
Once you're satisfied with the preview output:
- Click Insert Dynamic Content
- The resolved or placeholder expression will be inserted into the appropriate field (body, URL, header, etc.)
Running the Complete Flow
Once all blocks are set up and connected:
Click the “Run” Button
- Executes each block sequentially.
- Resolves all dynamic content and expressions on the fly.
- Passes relevant output data between the blocks.
This is especially helpful for:
- Authentication + usage (login → token → use token)
- Create + update + fetch workflows
- Pagination and search flows
Best Practices & Tips
- Use clear block names for readability in expressions.
- Test each block independently before chaining.
- Use Run Preview to catch logic issues early.
- Validate all referenced fields actually exist in the response.
- Use
||fallback operators in case values are undefined.
Example with fallback:
$$Block_3.response.body.email || "default@example.com"
Conclusion
Dynamic expressions in Sparrow empower you to build flexible, maintainable, and data-driven workflows across your API test collections.
By combining previous responses, helper functions, and expression evaluation, you can eliminate hardcoding and automate your entire flow.
Schedule Run Management
Schedule Run Management enables you to automate test execution at predefined times or intervals, eliminating the need for manual intervention.
By configuring when and how frequently your tests run, selecting execution environments, and setting up notifications, you can maintain consistent test coverage and quickly identify issues through automated monitoring.
Key Features
- Time-based scheduling
- Environment configuration
- Notification alerts
- Multi-recipient email notifications
- Parallel execution support
Benefits
- Consistent Testing
- Early Issue Detection
- Shared Awareness
- Better Resource Utilization
- Enhanced Collaboration
- Improved Efficiency
How Sparrow Implements It
- Access Schedule Run – Open it from inside the test flow or from the options menu of your created test flow.
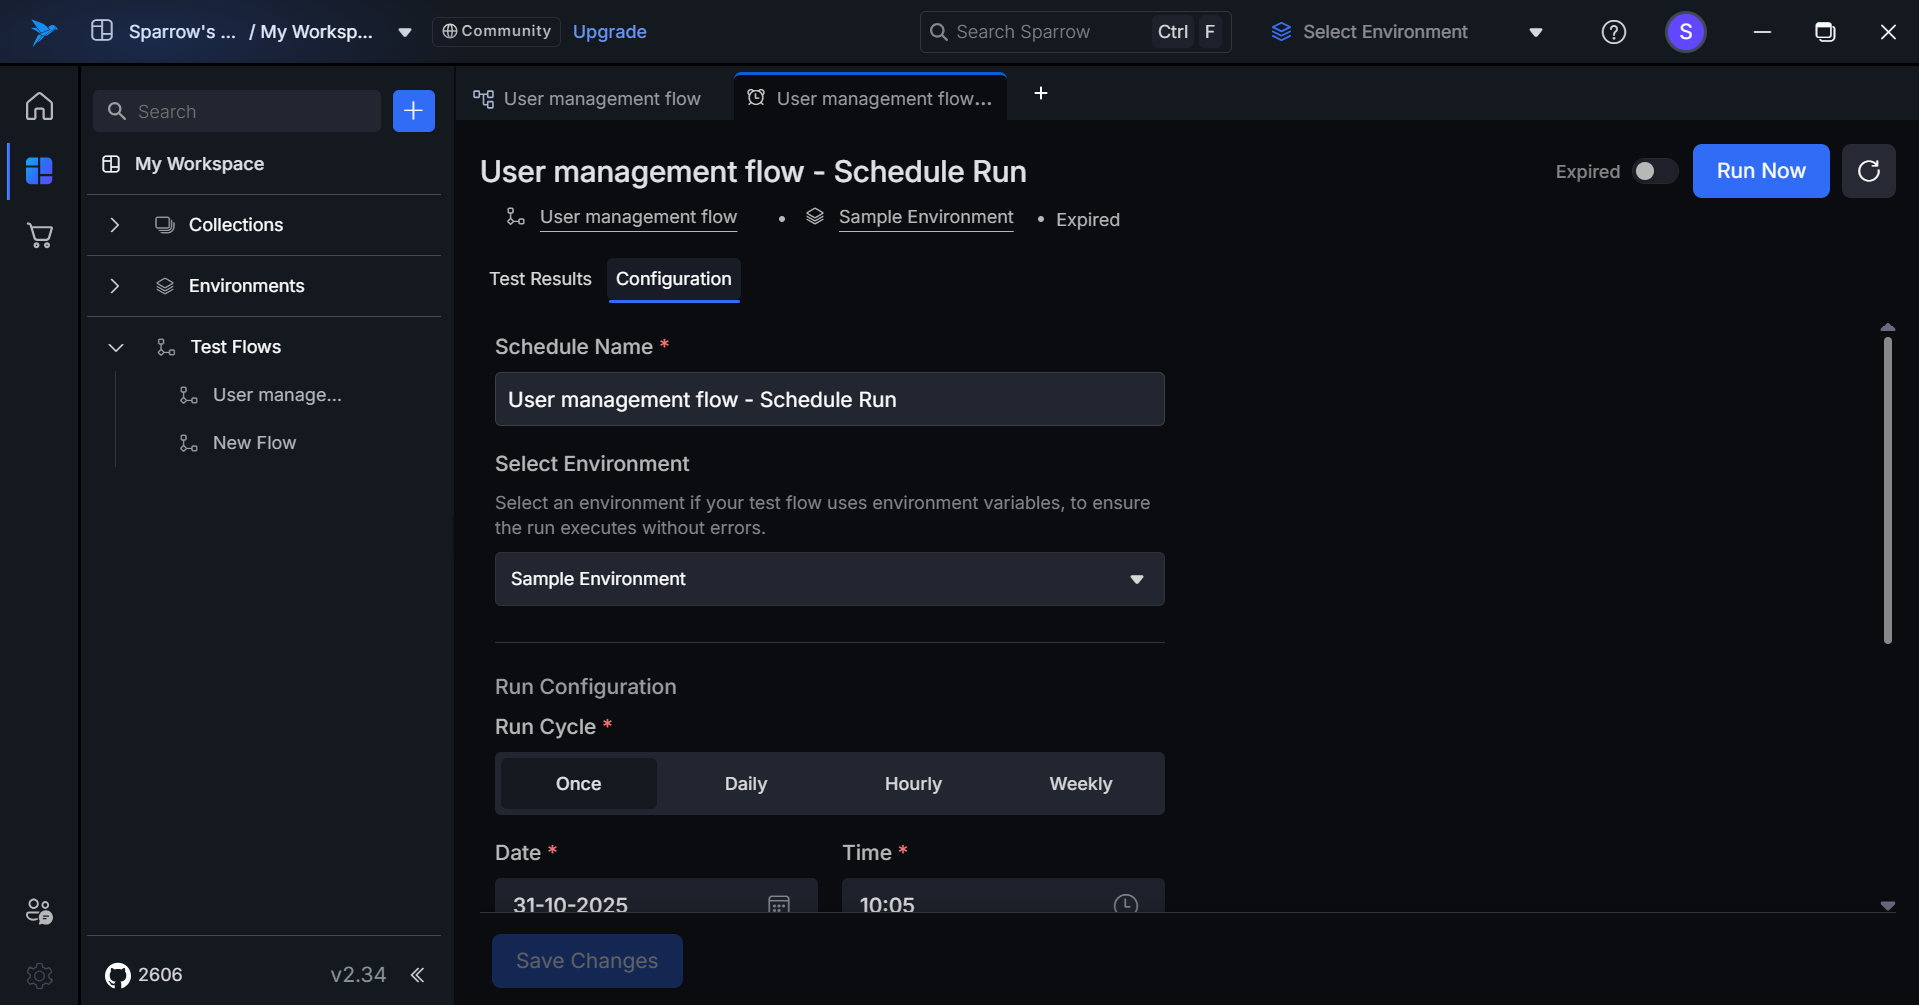
- Name and Environment – Enter a descriptive schedule name and select your target environment from the dropdown.
- Run Configuration – Choose your execution frequency: Once, Daily, Hourly, or Weekly.
- Set Timing – Configure the start date, execution time, and frequency based on your selected run type.
- Configure Notifications – Add recipient email addresses and select your preferred notification options (success, failure, or both).
Ideal Use Cases
- Execute comprehensive test flows every night to identify breaking changes early.
- Run scheduled tests before releases to verify build quality and stability.
- Automate health checks for live endpoints to catch downtime or performance degradation.
How to Add a Scheduled Run
Follow these steps to create and configure a scheduled test execution:
Step 1: Access Schedule Run
Open the Schedule Run feature using one of these methods:
- Navigate to your test flow and click the Schedule Run option from within the test flow window.
- Locate your test flow in the list and select Schedule Run from the options menu.
Step 2: Name Your Schedule
A pop-up menu appears. Enter a descriptive name for your schedule that clearly identifies its purpose.
Example:
- "Daily Regression Tests"
- "Hourly API Health Check"
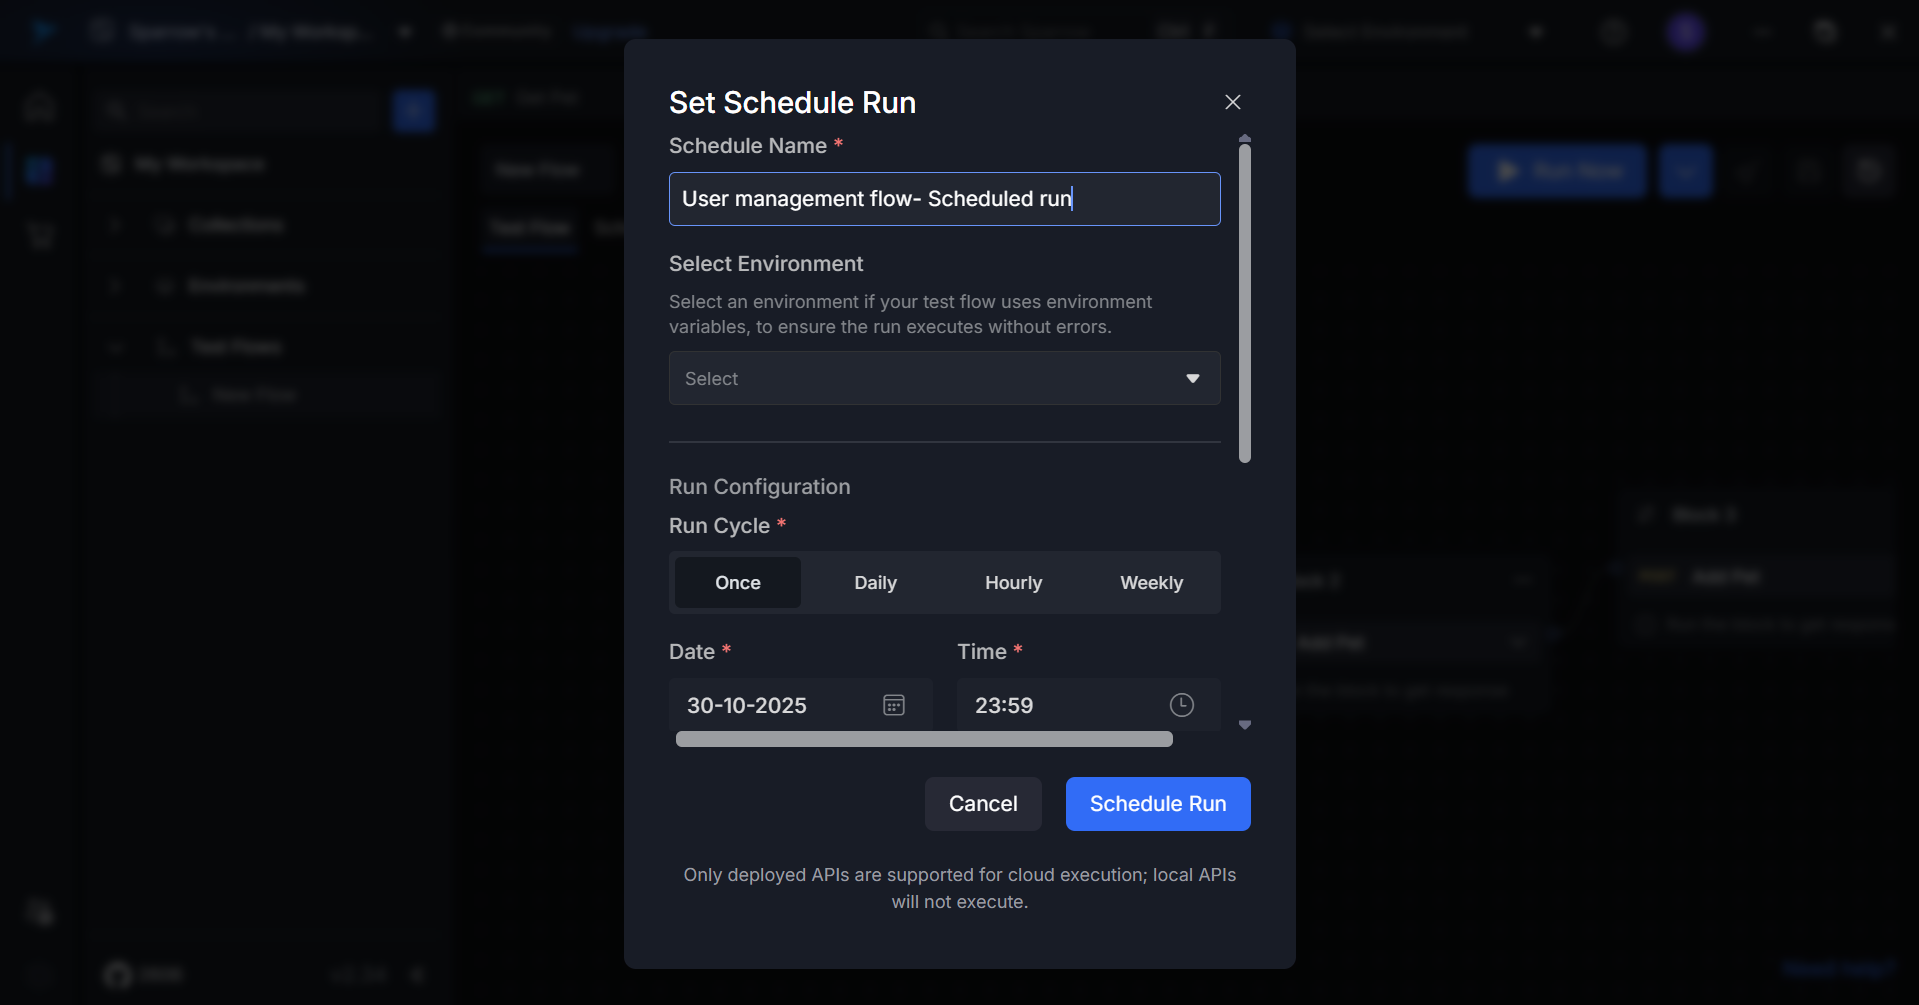
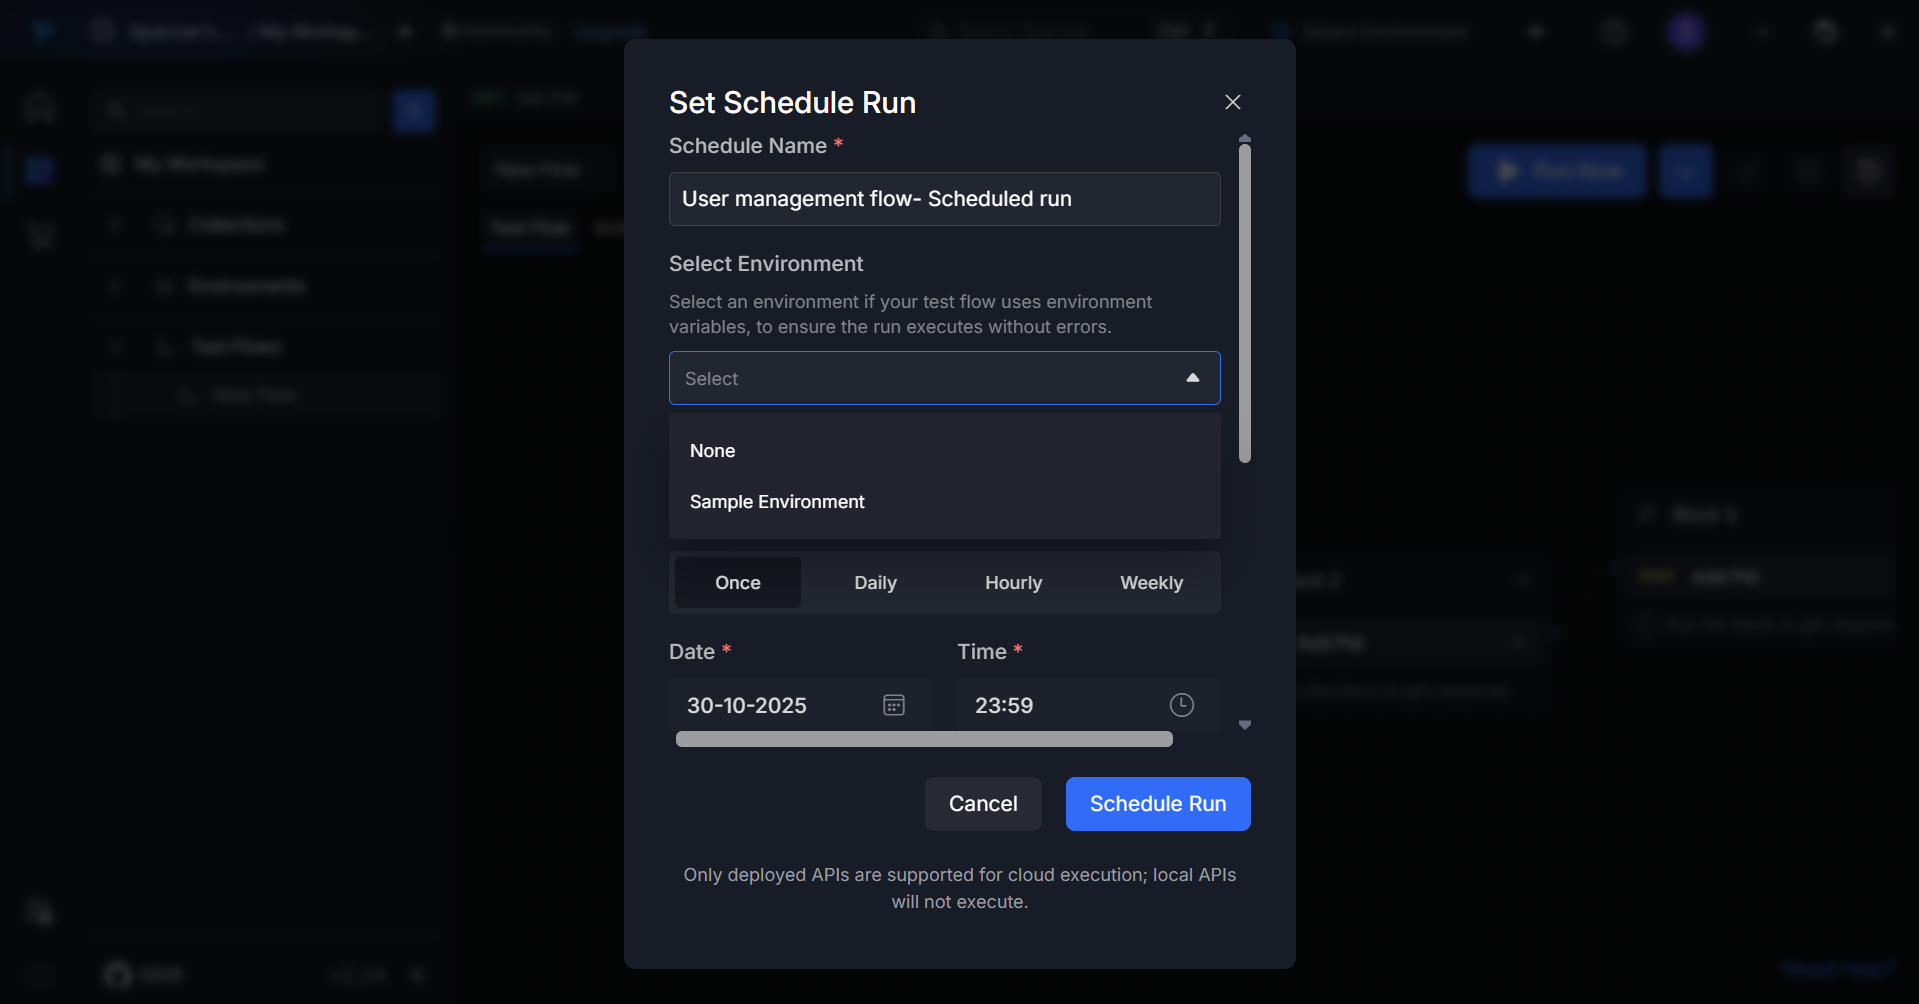
Step 3: Select Environment
Choose the target environment where the test should execute from the dropdown menu.
Available options:
- Development
- Staging
- Production
(or as configured in your workspace)
Step 4: Choose Run Configuration
Select the frequency at which your test should run:
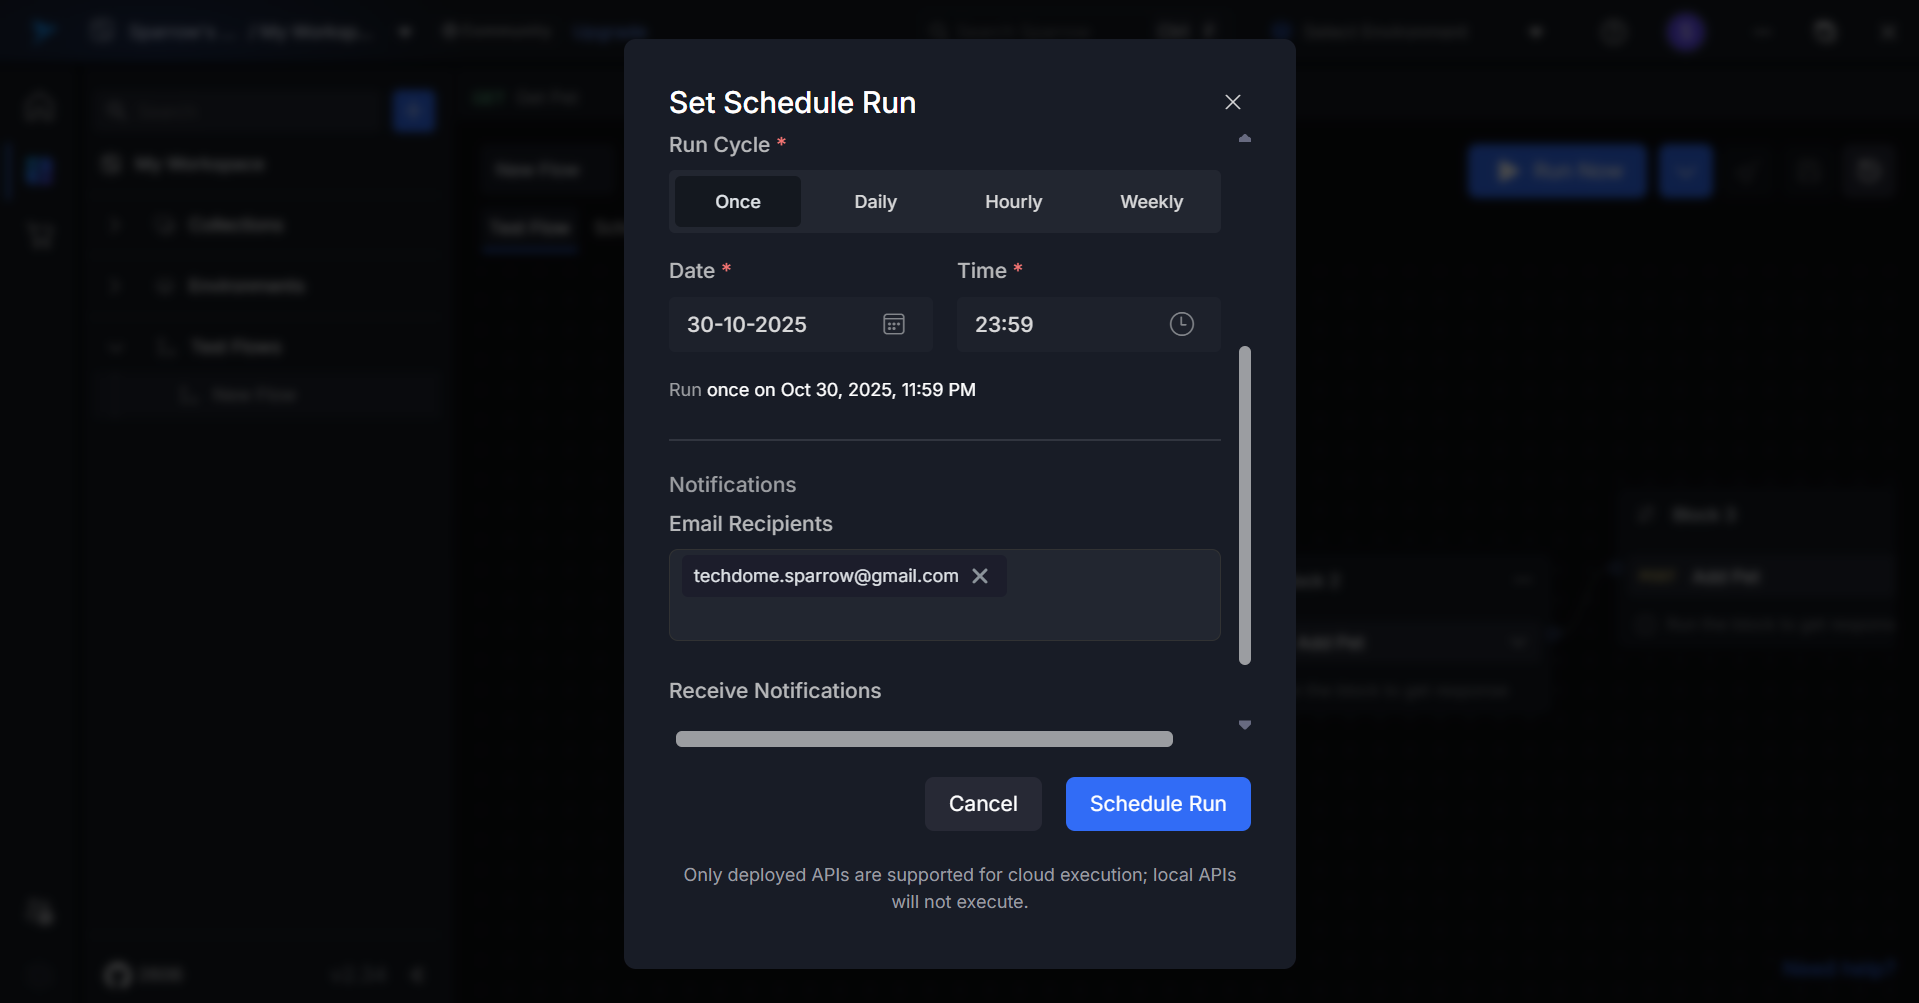
- Once – Execute at a single specified date and time
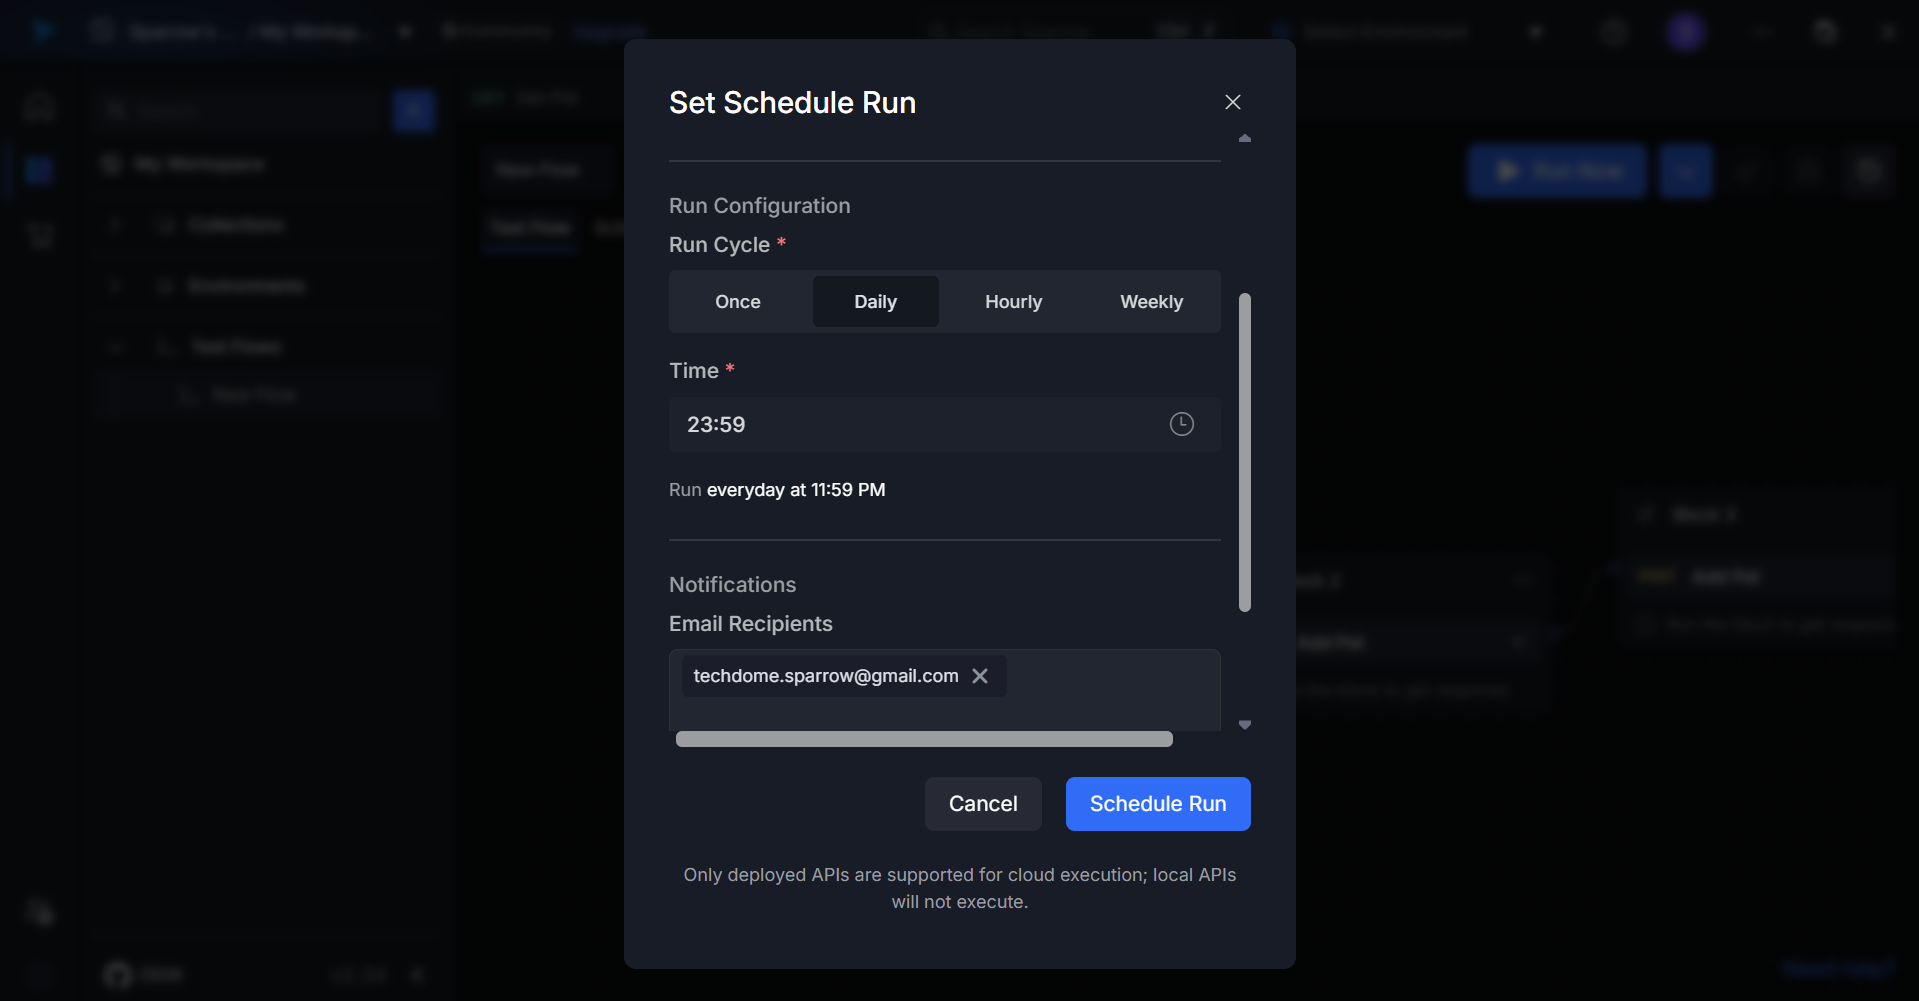
- Daily – Run every day at a set time
- Hourly – Execute at regular intervals throughout the day
- Weekly – Run on specific days of the week at a specified time
Step 5: Configure Timing
Set the scheduling details based on your selected run configuration:
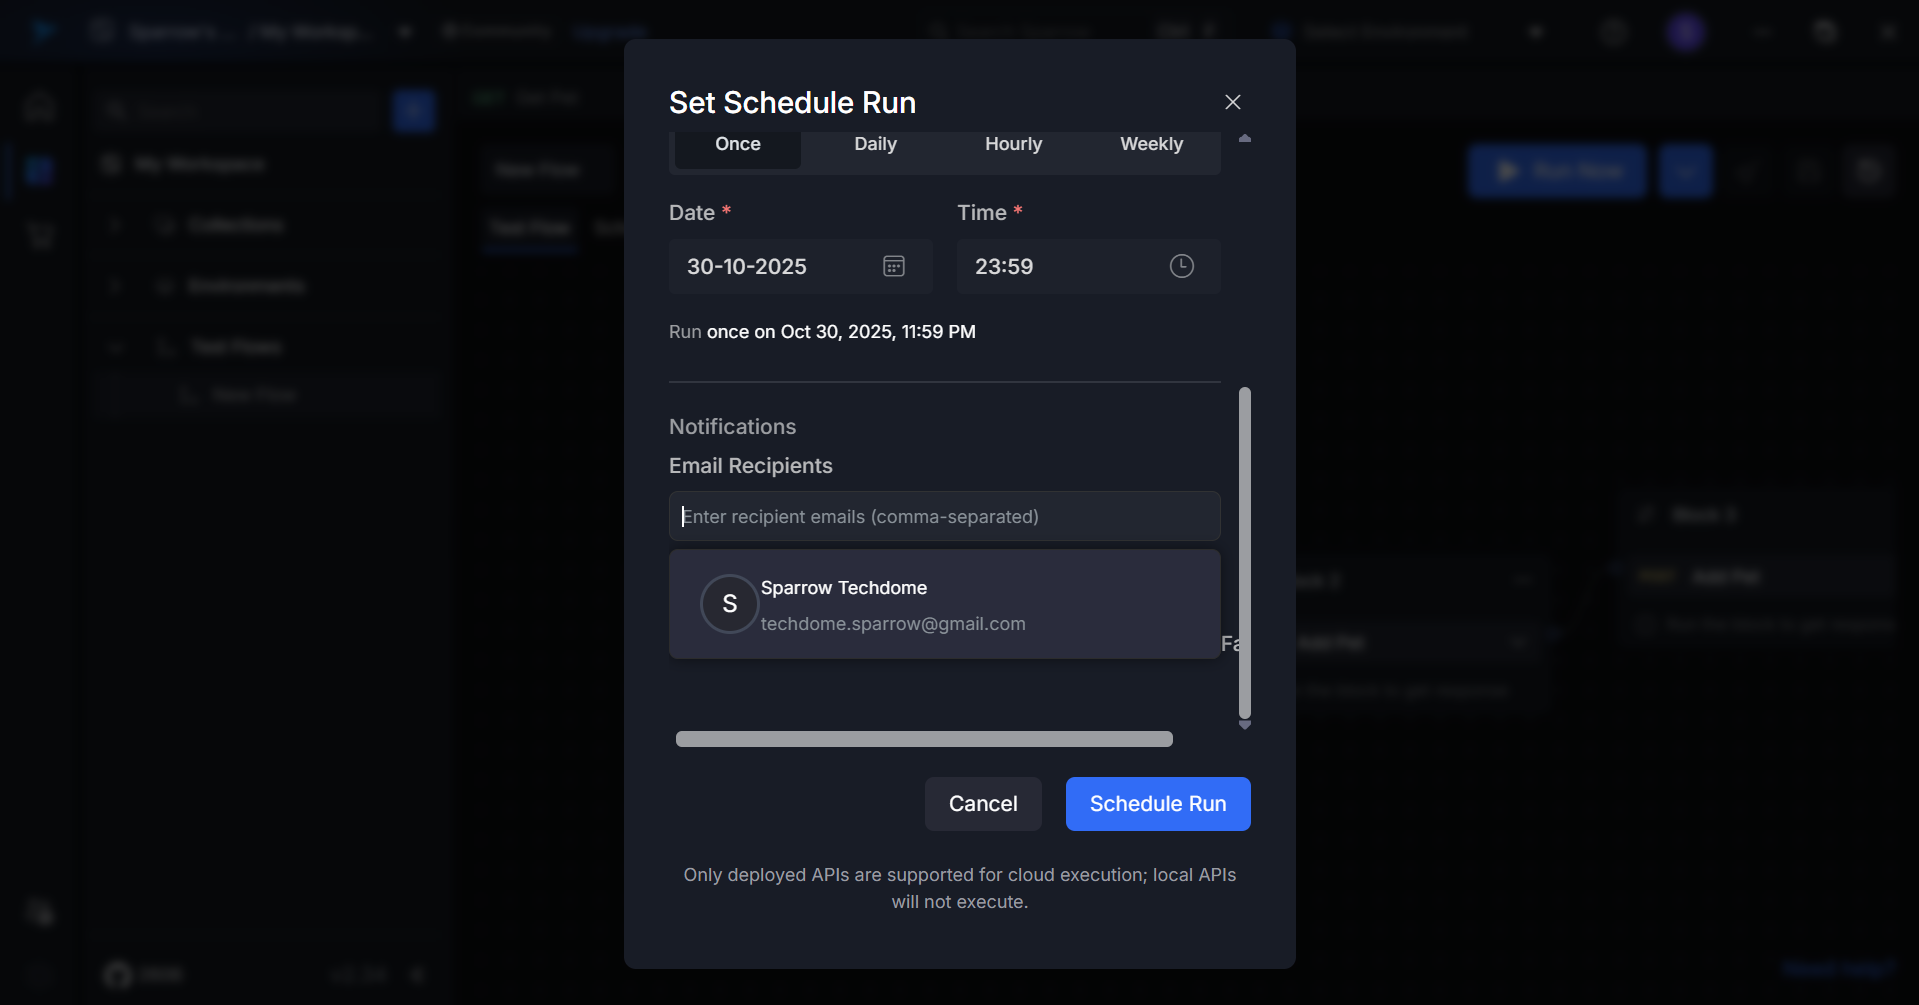
For Once:
- Select the date when the test should run
- Set the time for execution
For Daily:
- Set the time when the test should run each day
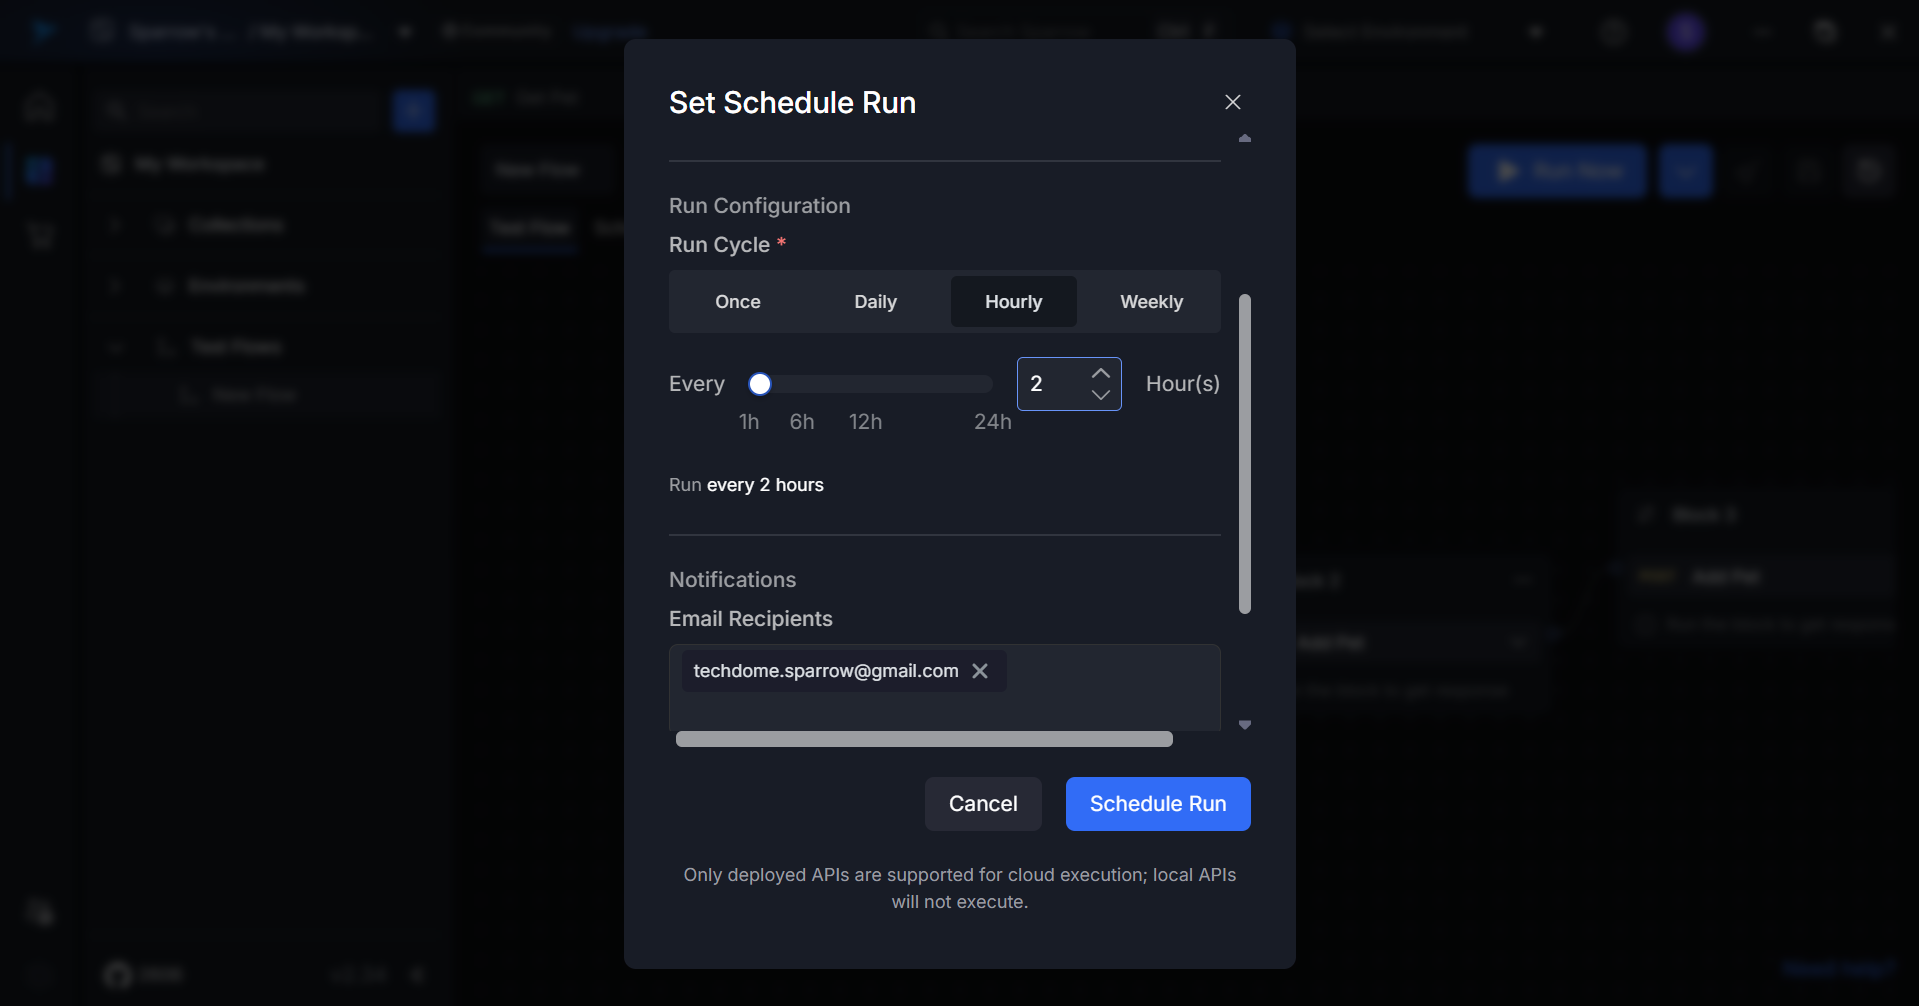
For Hourly:
- Define the interval (e.g., every 1 hour, every 2 hours)
- Set the start time for the schedule
For Weekly:
- Select the days of the week (e.g., Monday, Wednesday, Friday)
- Set the time for execution on selected days

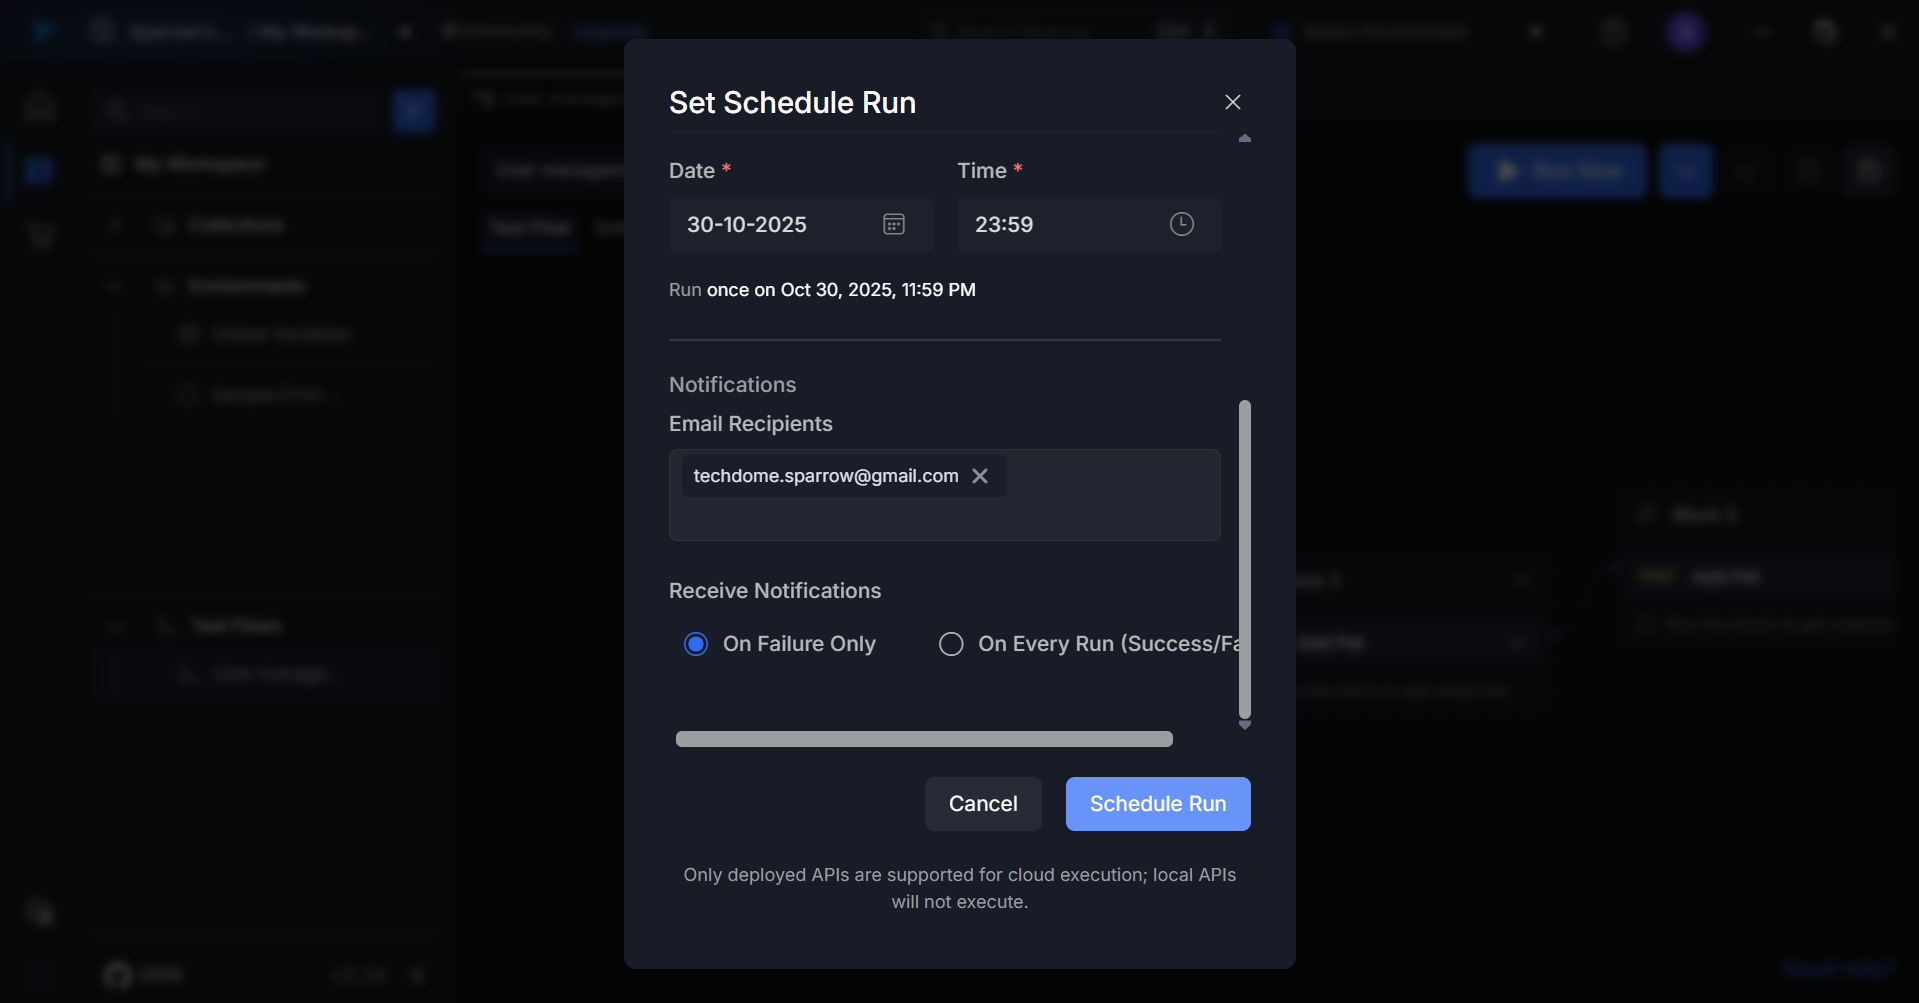
Step 6: Add Email Recipients
Enter the email addresses of team members who should receive notifications about test results.
To add multiple recipients:
- Type the first email address and press Enter or add a comma
- Continue adding additional email addresses as needed
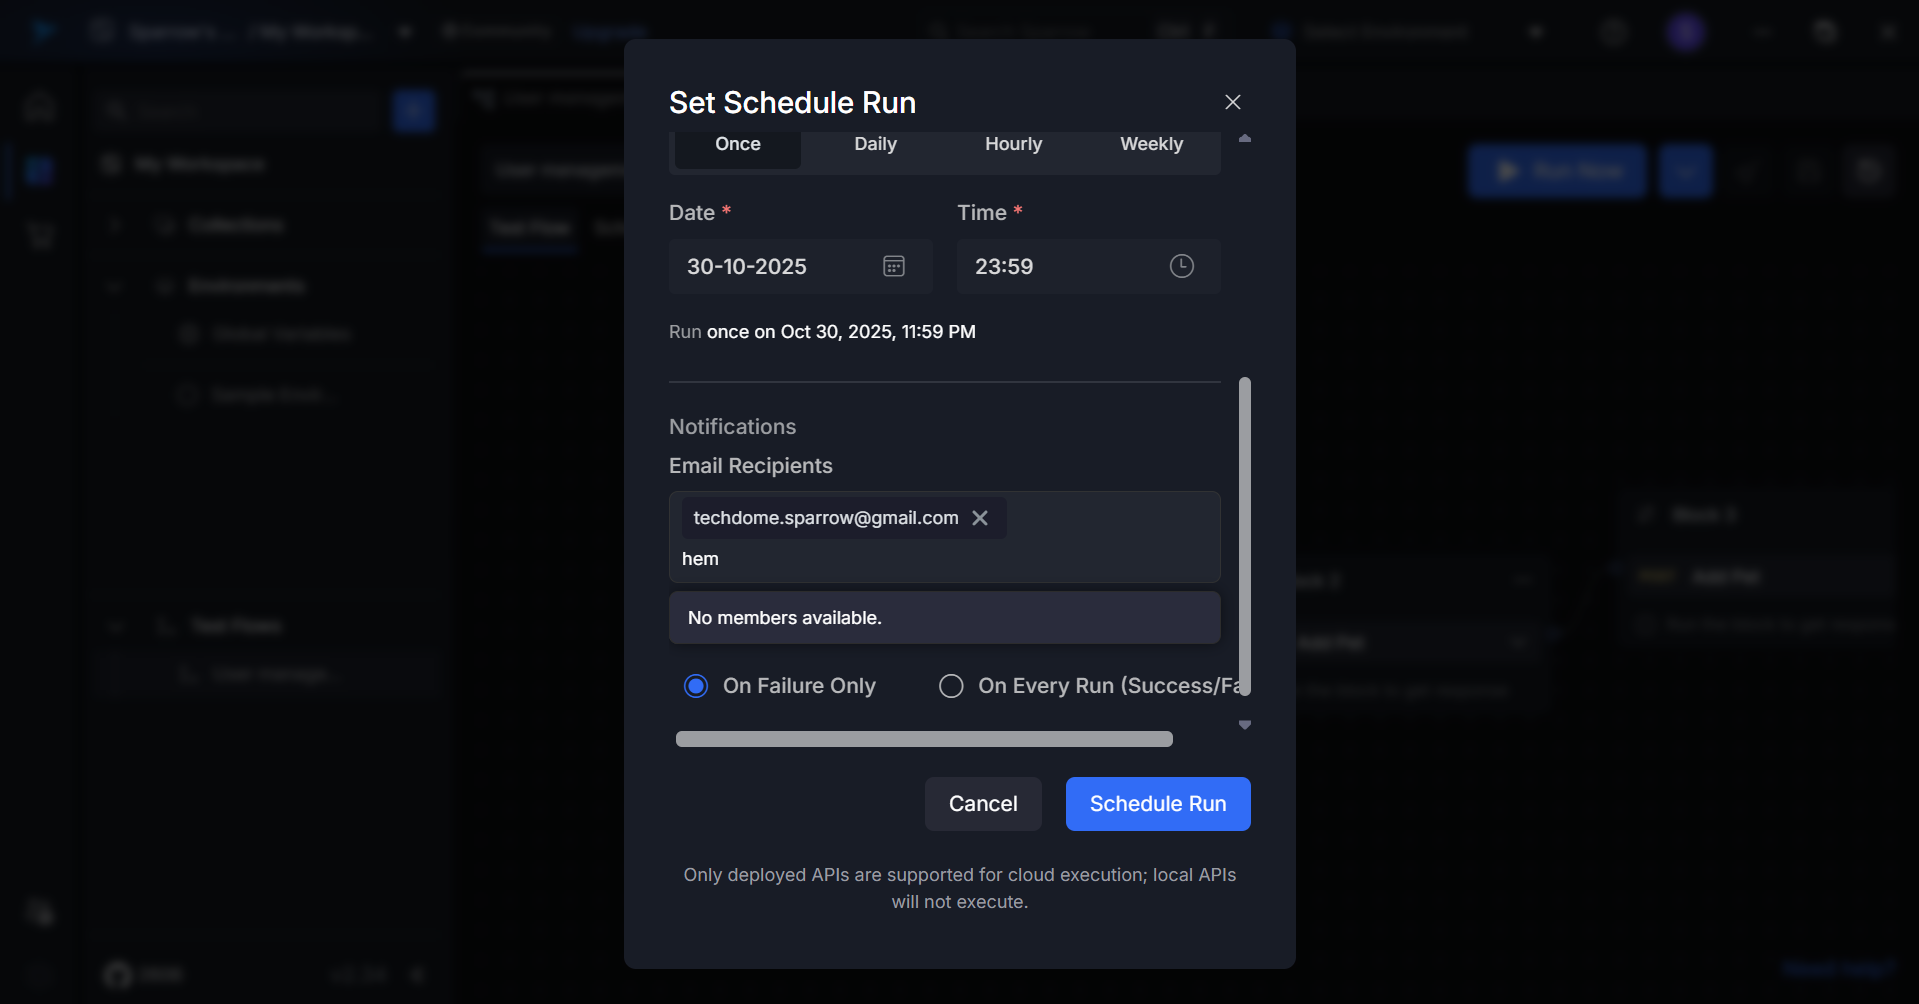
When clicking the email field:
- A dropdown appears showing existing workspace members.
- If no members are added to the workspace, a message “No members available” is displayed.
- If an invalid email address is entered, an error appears saying “Please enter a valid email address” upon clicking the Schedule Run button.
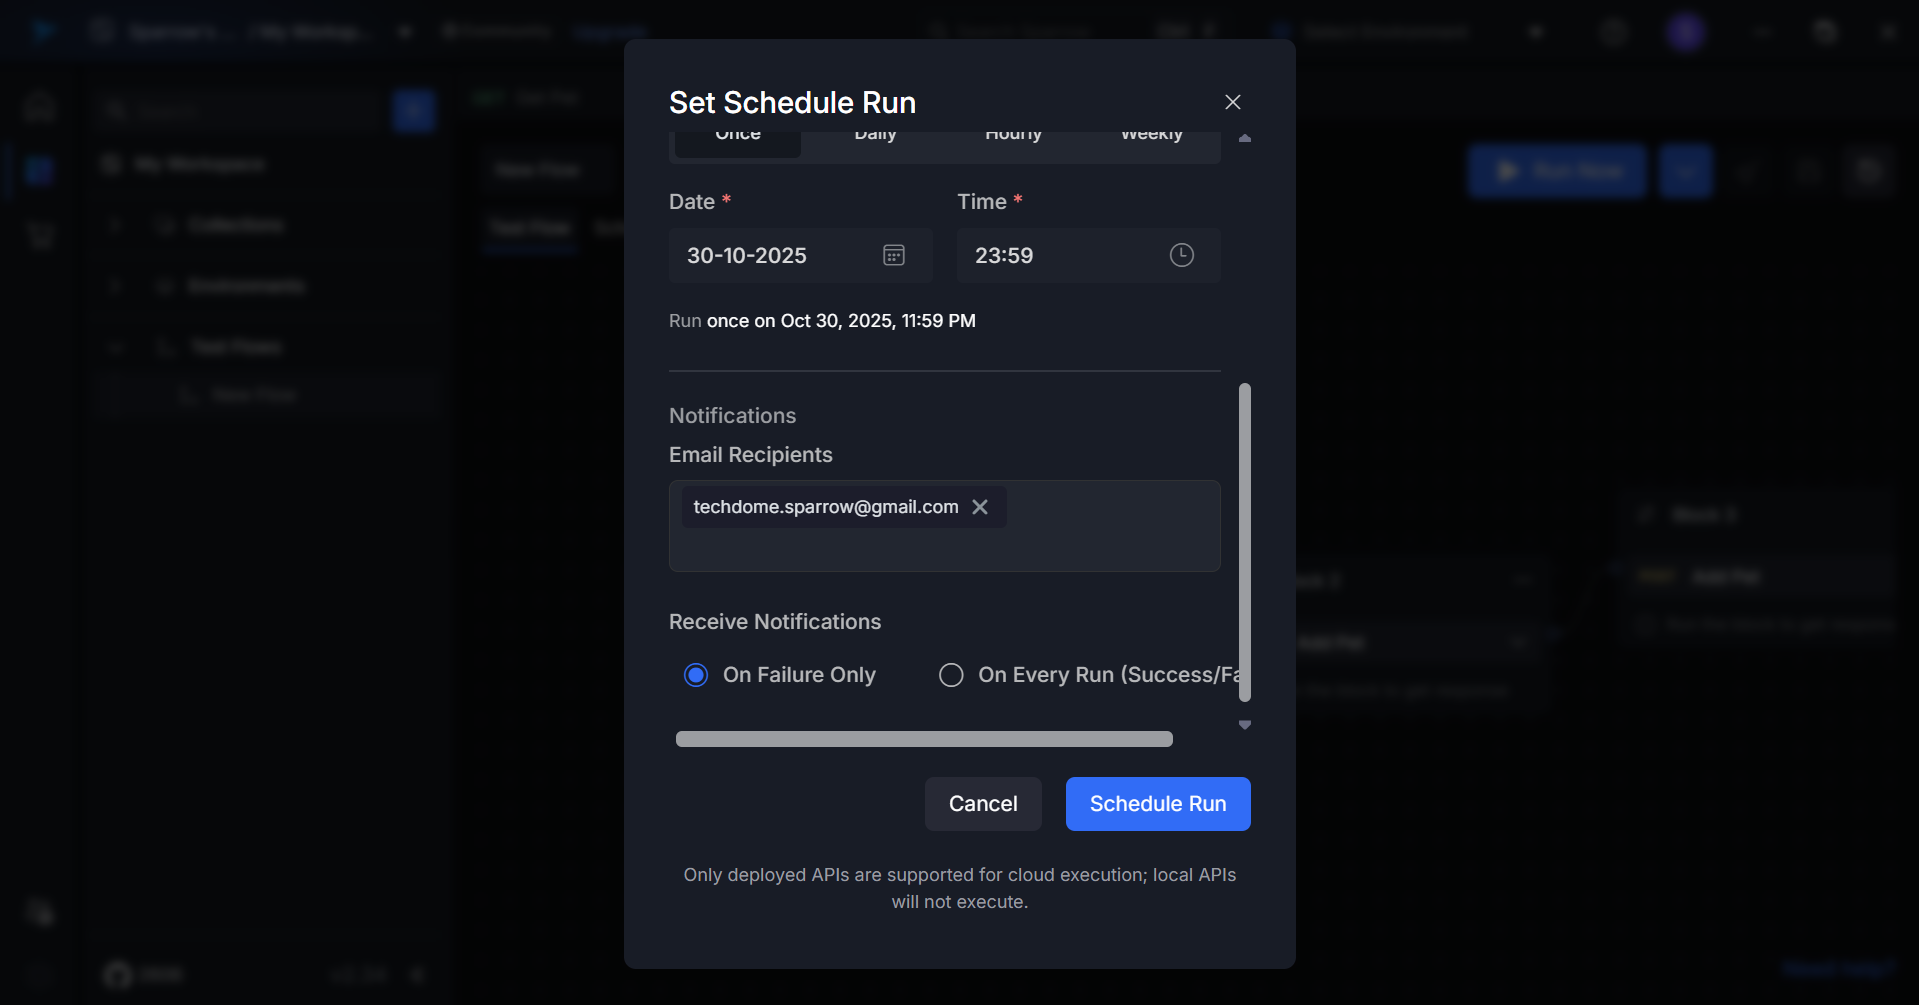
Step 7: Configure Notification Preferences
Select which notifications you want to receive:
- On Failure Only – Receive notifications only when tests fail
- On Every Run (Success/Failure) – Receive notifications for all test outcomes
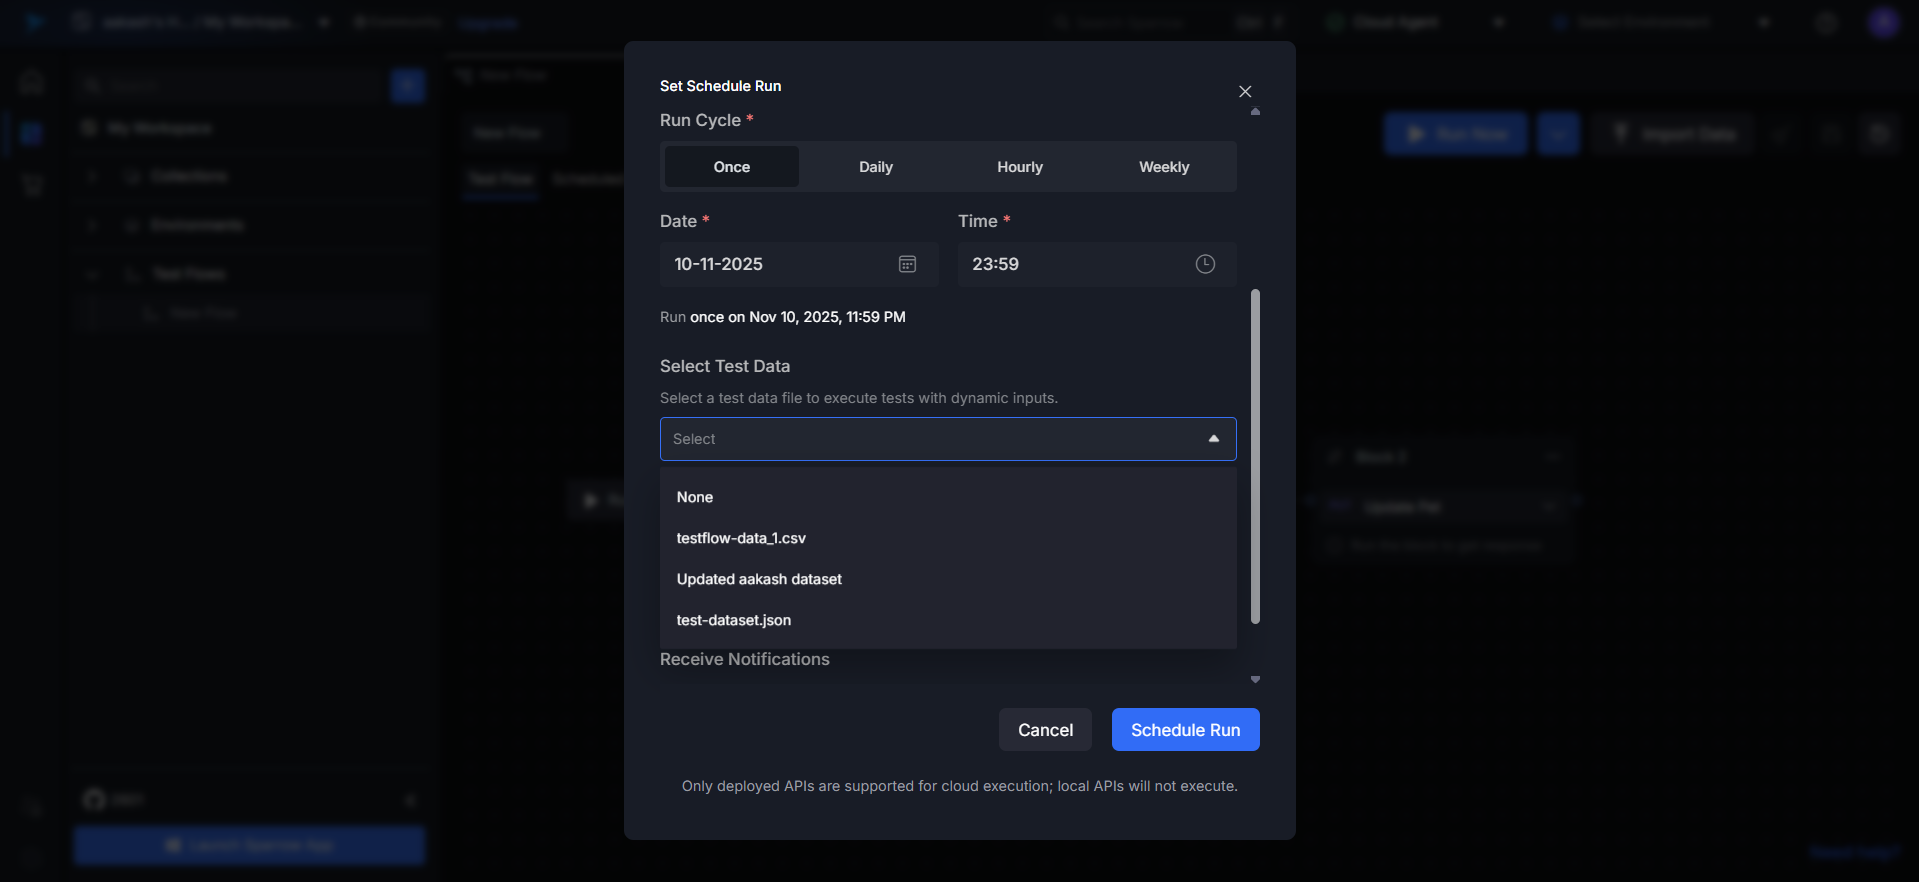
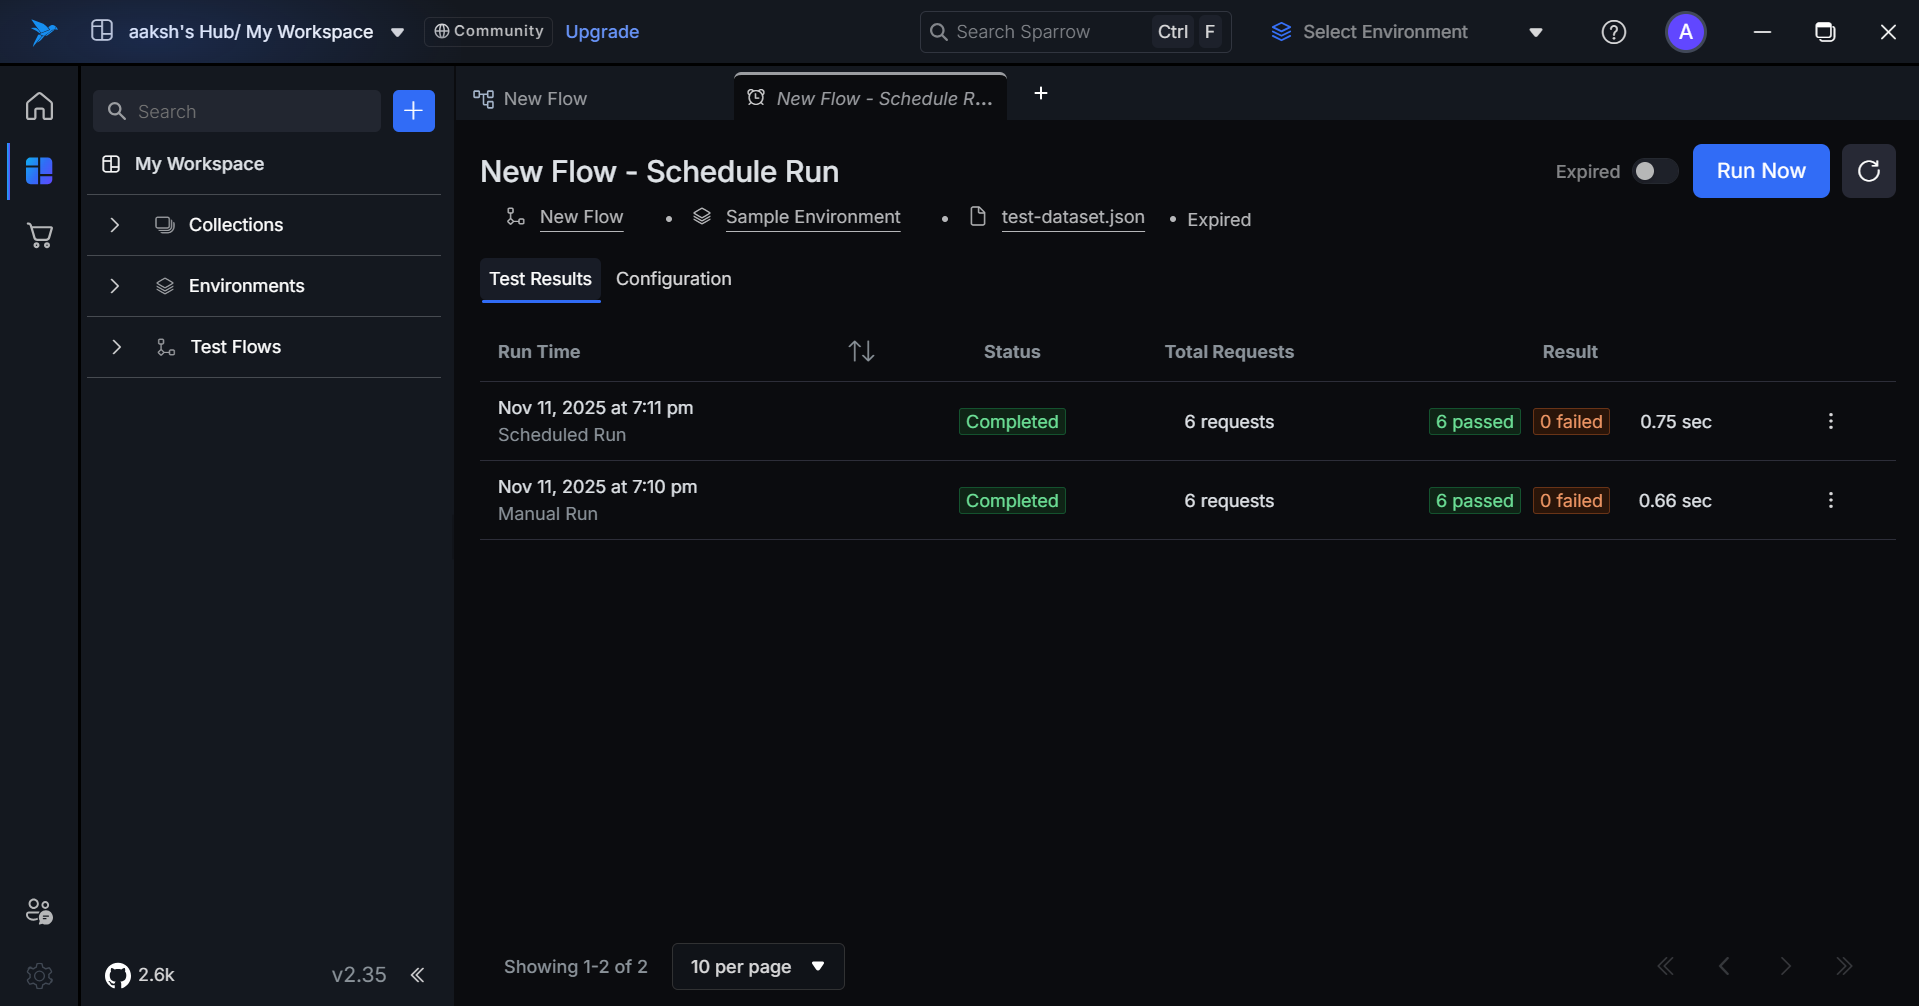
Step 8: Testflow TestData
Select the Testflow DataSet from the dropdown list of available datasets. You can also preview the test data content required for execution. Selecting this dataset is optional—you can run a standard Testflow schedule without it as well.
Step 9: Add Email Recipients && Click on Schedule Run
Click the Schedule Run button to activate your scheduled test execution.
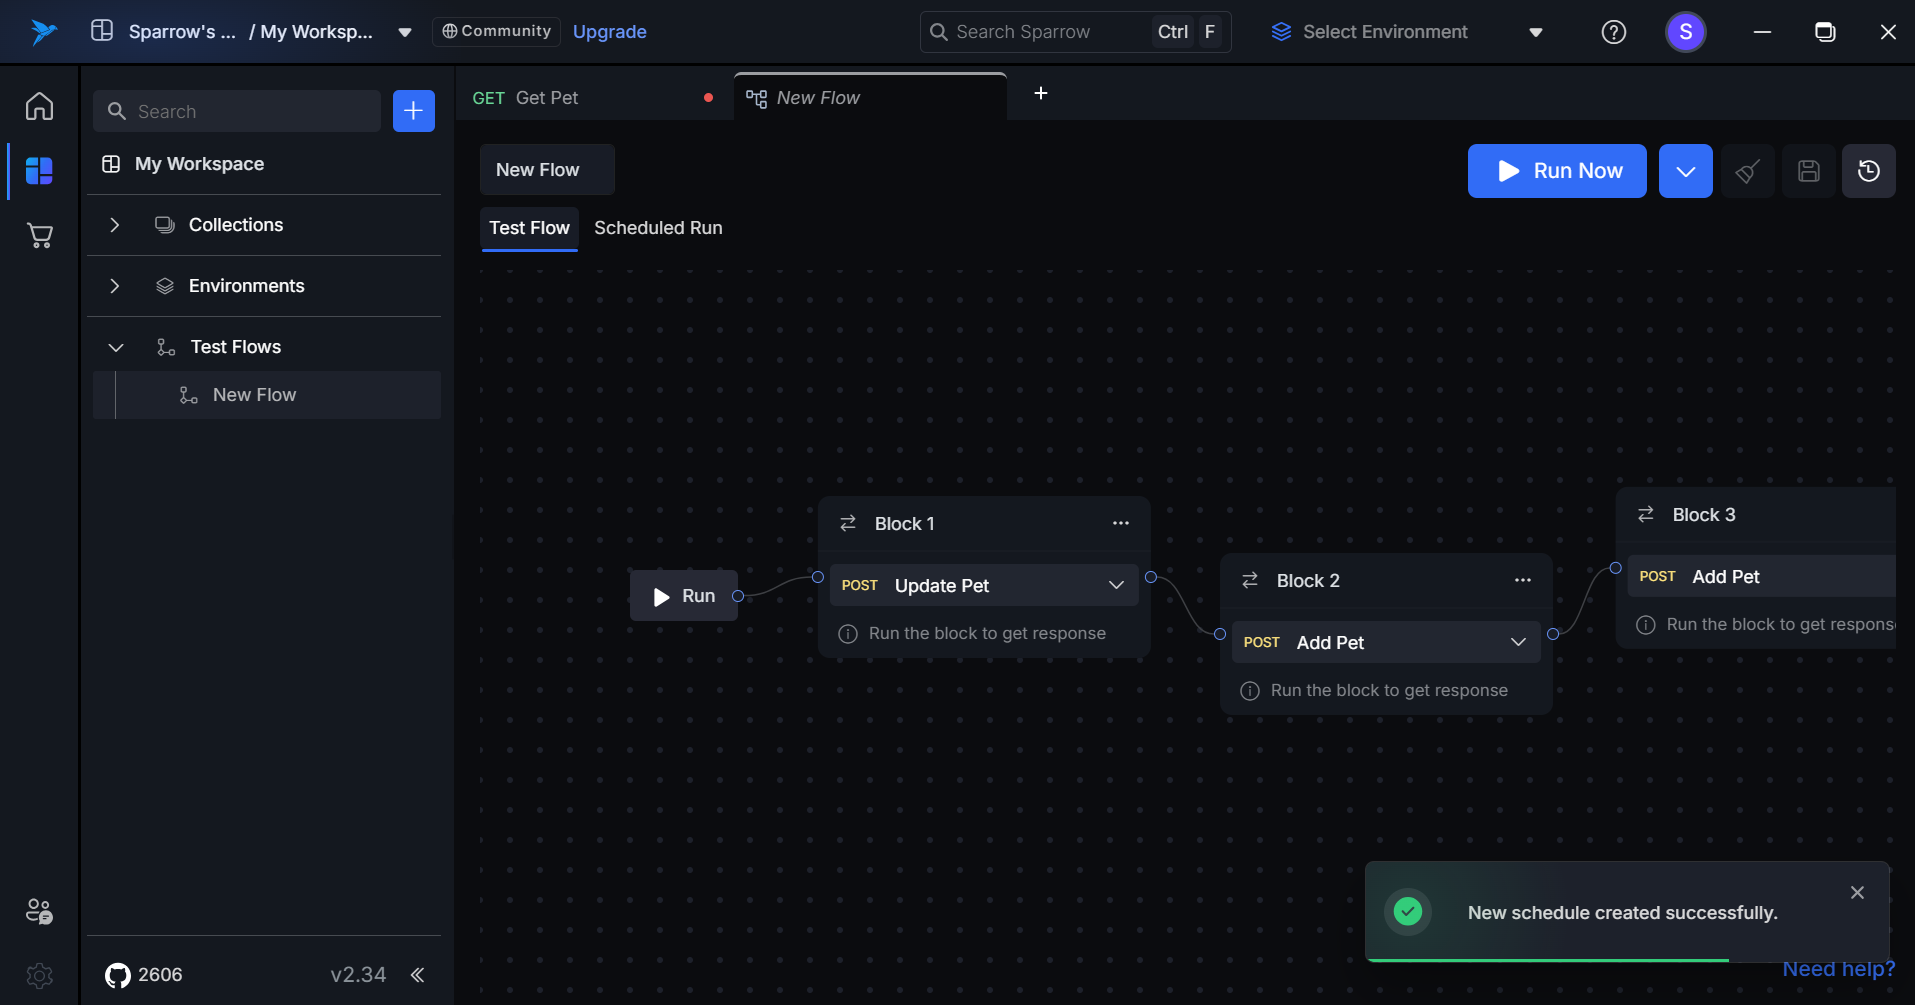
Successful Schedule Creation
Your test flow will now execute automatically according to the configured schedule.
Notifications will be sent to all specified recipients.
A message saying “New Schedule Created Successfully” appears in green at the bottom-right corner of the screen.
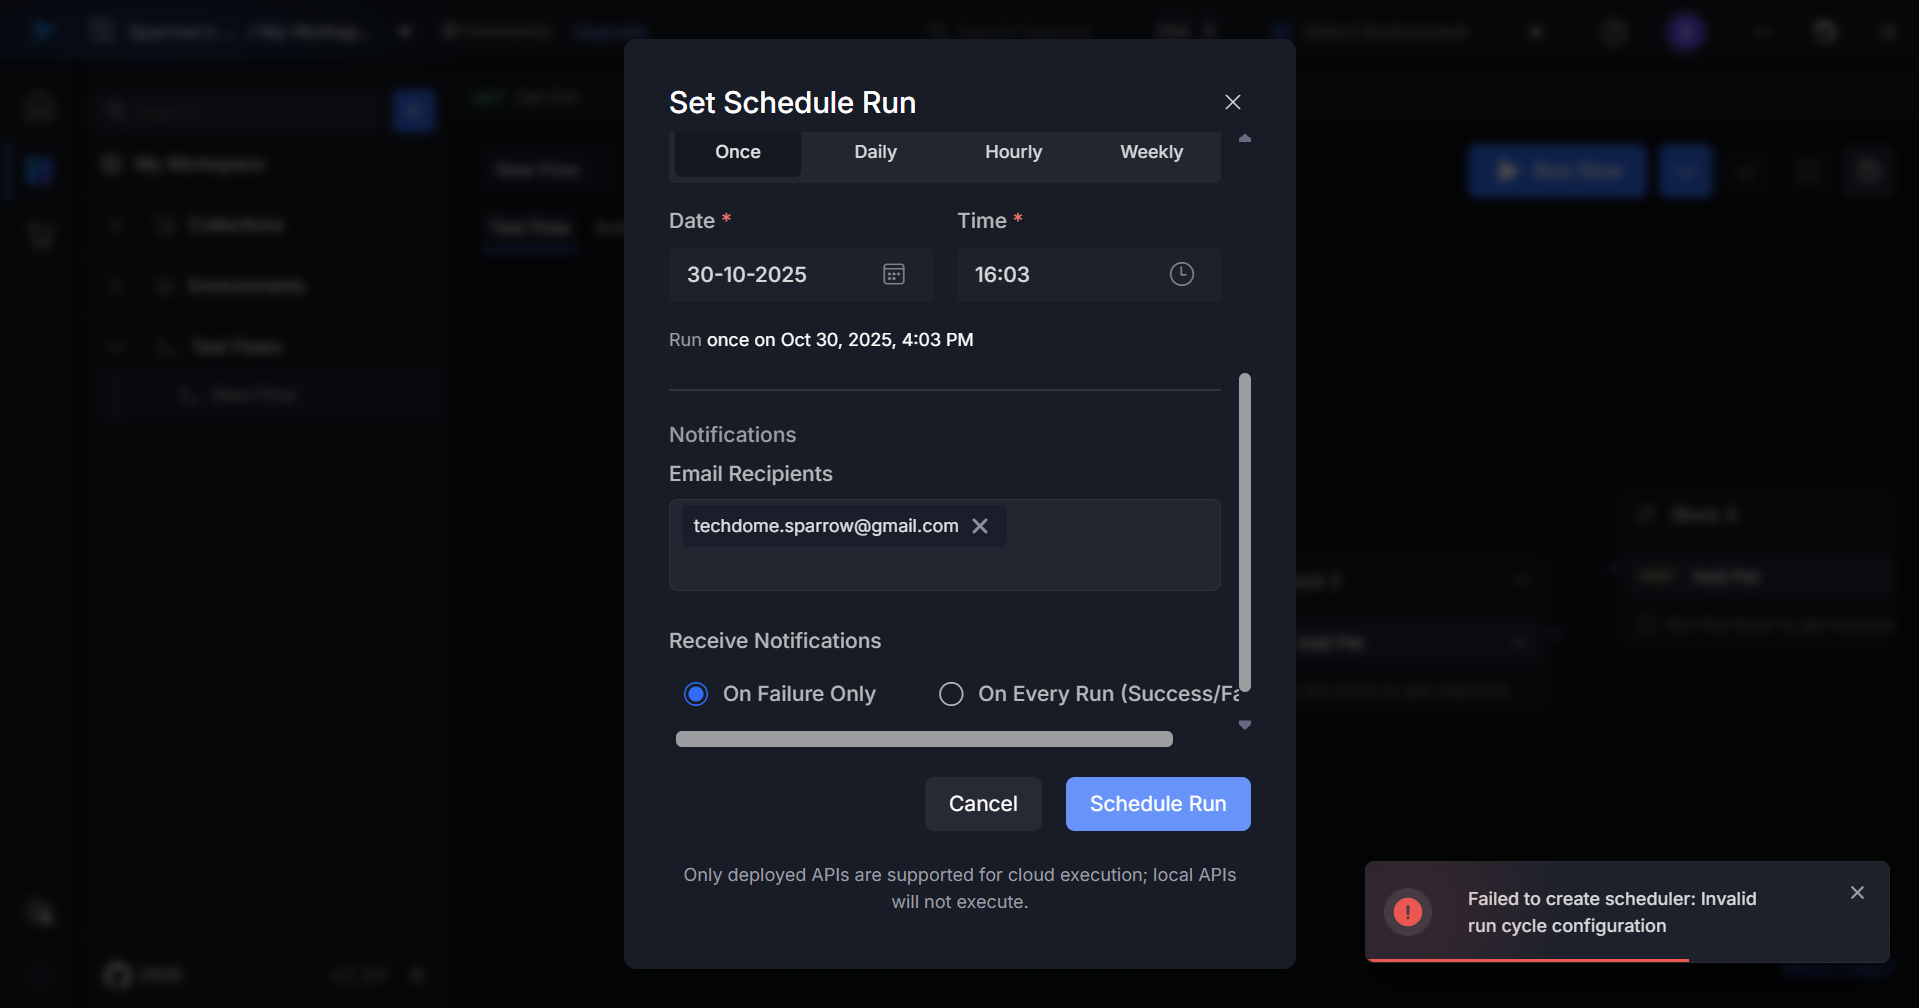
Failed Schedule Creation If a schedule fails to be created due to missing required fields or validation errors:
- A red error notification appears at the bottom-right corner.
- Verify all fields are filled correctly and resubmit to ensure successful execution.
TestFlow Dataset Management
TestFlow Dataset Management provides a comprehensive system for importing, managing, and utilizing test data within your testing workflows. The system supports both JSON and CSV file formats, allowing you to organize test data into reusable datasets that can be referenced across multiple test flows.
Data Structure of file.
Dataset Format
TestFlow datasets follow a structured format where each dataset contains an array of test data items:
Record<string, any>[]
Data Item Structure
Each item in the dataSet array is a Record<string, any> object, meaning:
- Keys: String identifiers for each field
- Values: Any valid JSON data type (string, number, boolean, object, array, null)
Example Dataset
[
  {
    "name": "Rahul Verma",
    "id": "104",
    "testname": "Login Functionality",
    "department": "Quality Assurance"
  },
  {
    "name": "Mahesh Patil",
    "id": "107",
    "testname": "Payment Gateway Integration",
    "department": "Development"
  },
  {
    "name": "Kishore Reddy",
    "id": "109",
    "testname": "Server Monitoring",
    "department": "Operations"
  }
]
Importing Test Data
Supported File Formats
- JSON: Standard JSON format with
.jsonextension - CSV: Comma-separated values with
.csvextension
JSON Import Requirements
When importing JSON files:
- File must contain a root-level
dataSetproperty dataSetmust be an array of objects- Each object can have any number of properties with any valid JSON value type
- All required fields should be present in each object
Valid JSON Structure:
[
    { "field1": "value1", "field2": "value2" },
    { "field1": "value3", "field2": "value4" }
]
CSV Import Requirements
When importing CSV files:
- First row must contain column headers
- Each subsequent row represents a data item
- Values are automatically parsed and converted to appropriate types
- Empty cells are treated as empty strings or null values
Example CSV:
name,id,testname,department
Rahul Mehra,104,User Authentication Flow,Quality Assurance
Mahesh Iyer,107,API Integration Test,Software Development
Kishore Nair,109,System Health Check,IT Operations
Import Process
- Navigate to TestFlow Dataset Management
- Click Import Dataset button
- Select your JSON or CSV file
- System automatically detects file type and validates structure
- Preview the imported data
- Provide a unique name for the dataset.
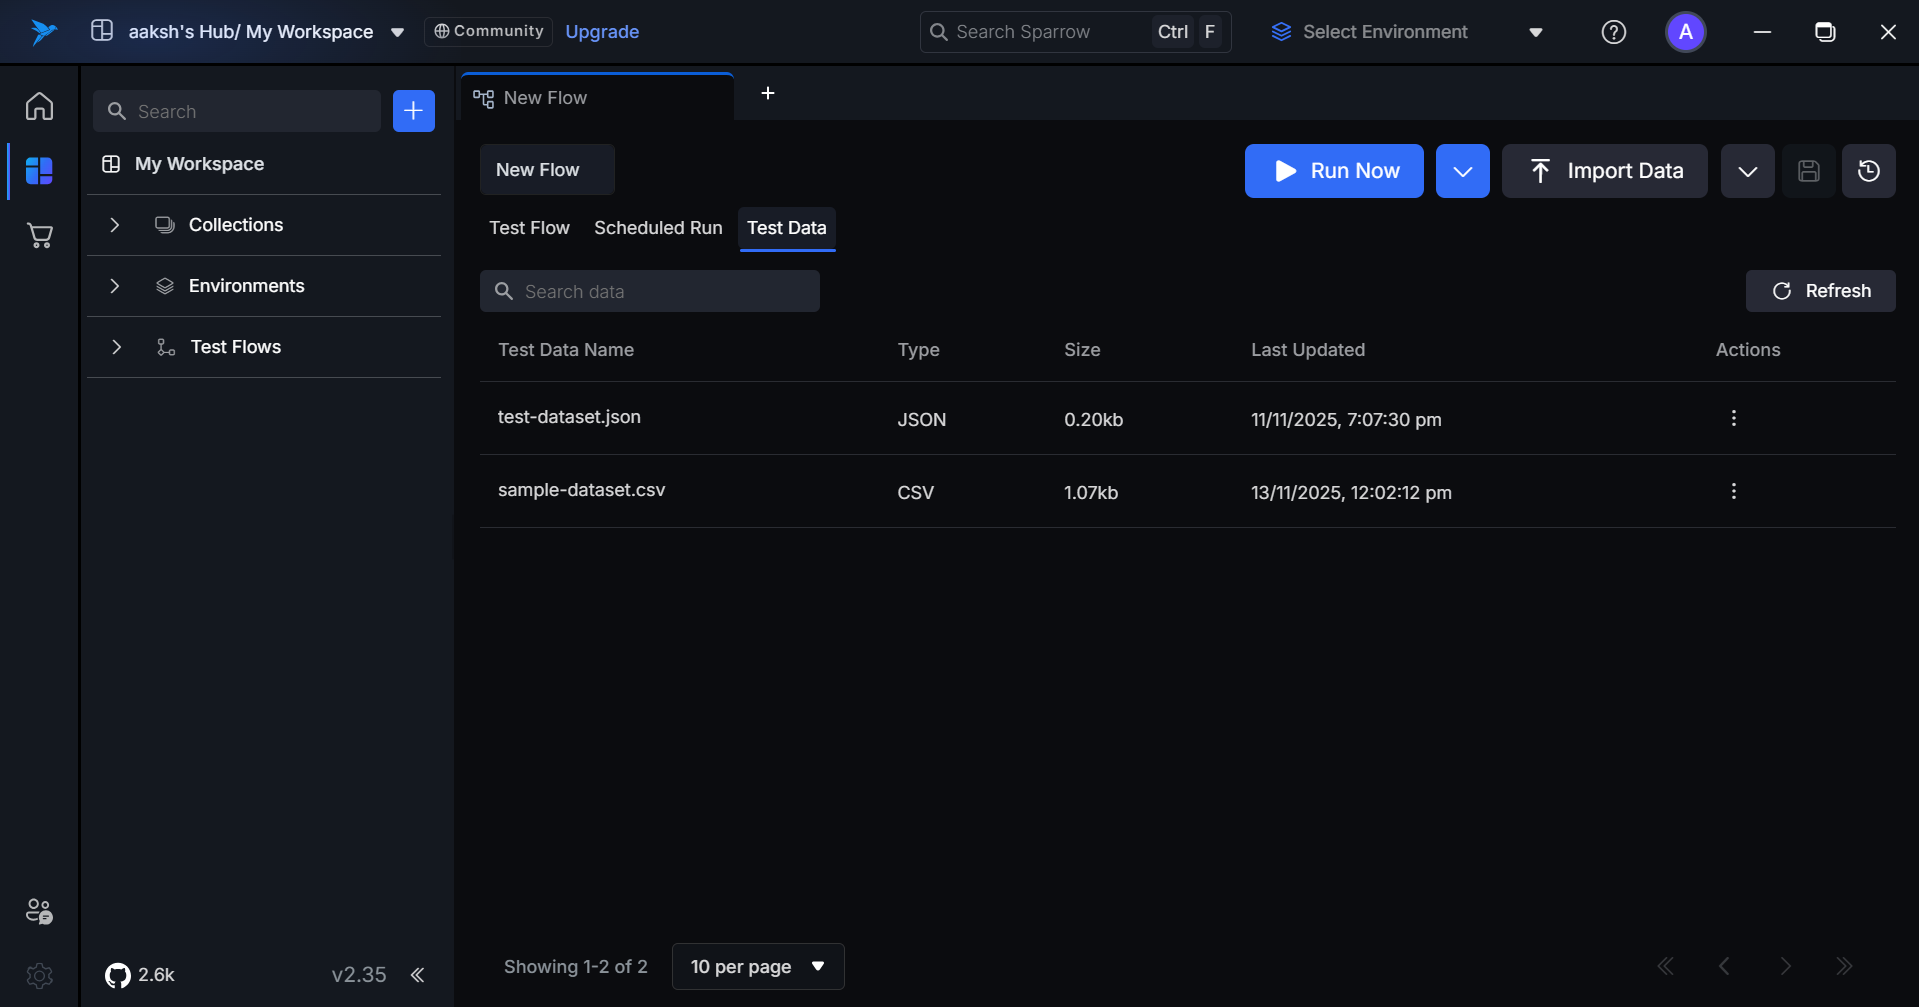
Overview Tab
The Dataset Management interface provides a centralized location to view and manage all imported test datasets.
Dataset List View
The main view displays all available datasets with the following information:
| Property | Description |
|---|---|
| Name | User-defined dataset name |
| File Type | Format of the original file (JSON/CSV) |
| Size | Total number of data items in the dataset |
| updated At | Date and time of dataset creation |
| Actions | Edit, Delete, and View options |
Available Actions
1. View Dataset
- Click on any dataset name to view complete details
- Displays full JSON content in a formatted, readable view
- Shows all metadata including:
- Dataset name
- File type
- Size (number of items)
- Complete
dataSetarray with all items
2. Edit Dataset
- Click the Edit icon next to any dataset
- Modify the following properties:
- Dataset Name: Change the display name
- Data Items: Add, remove, or modify individual data items
- Item Properties: Edit field names and values
- Changes are validated before saving
- Option to upload a replacement file (JSON/CSV)
3. Delete Dataset
- Click the Delete icon next to any dataset
- Permanent action - deleted datasets cannot be recovered
- Any test flows using the dataset will show an error and require reconfiguration
4. Export Dataset
- Click the Export icon next to any dataset
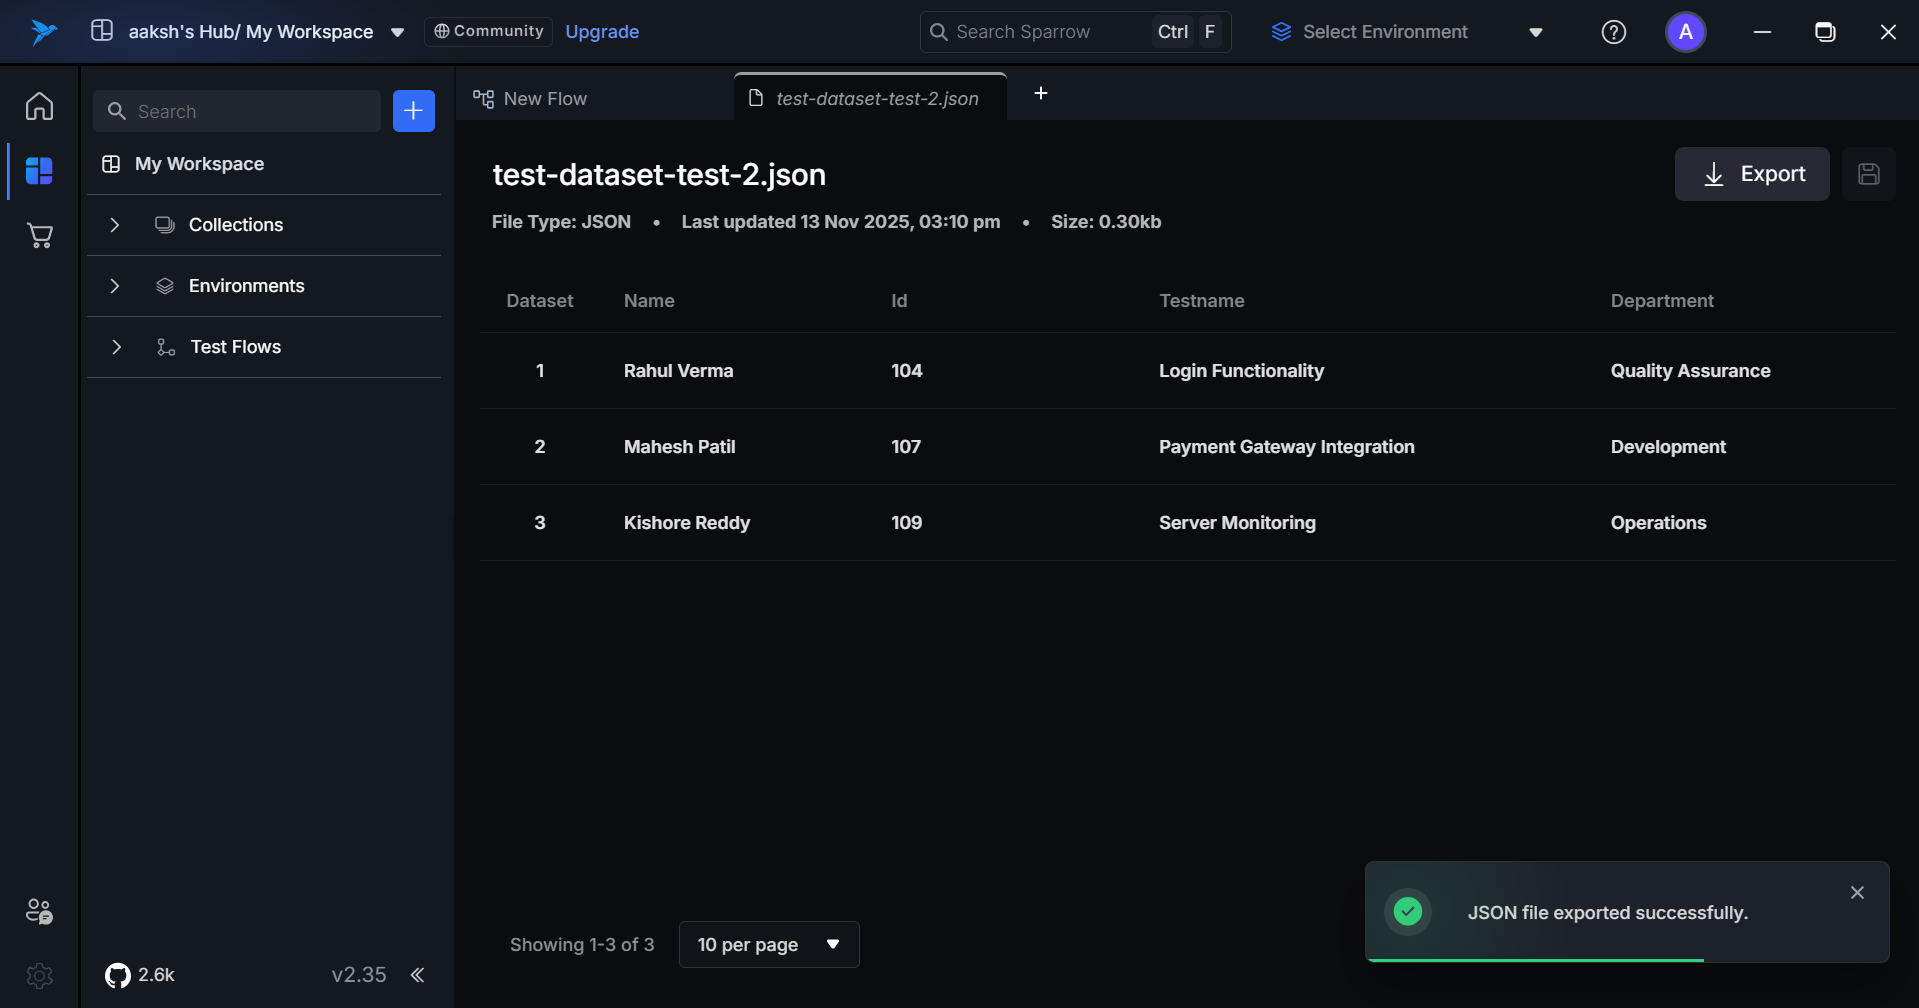
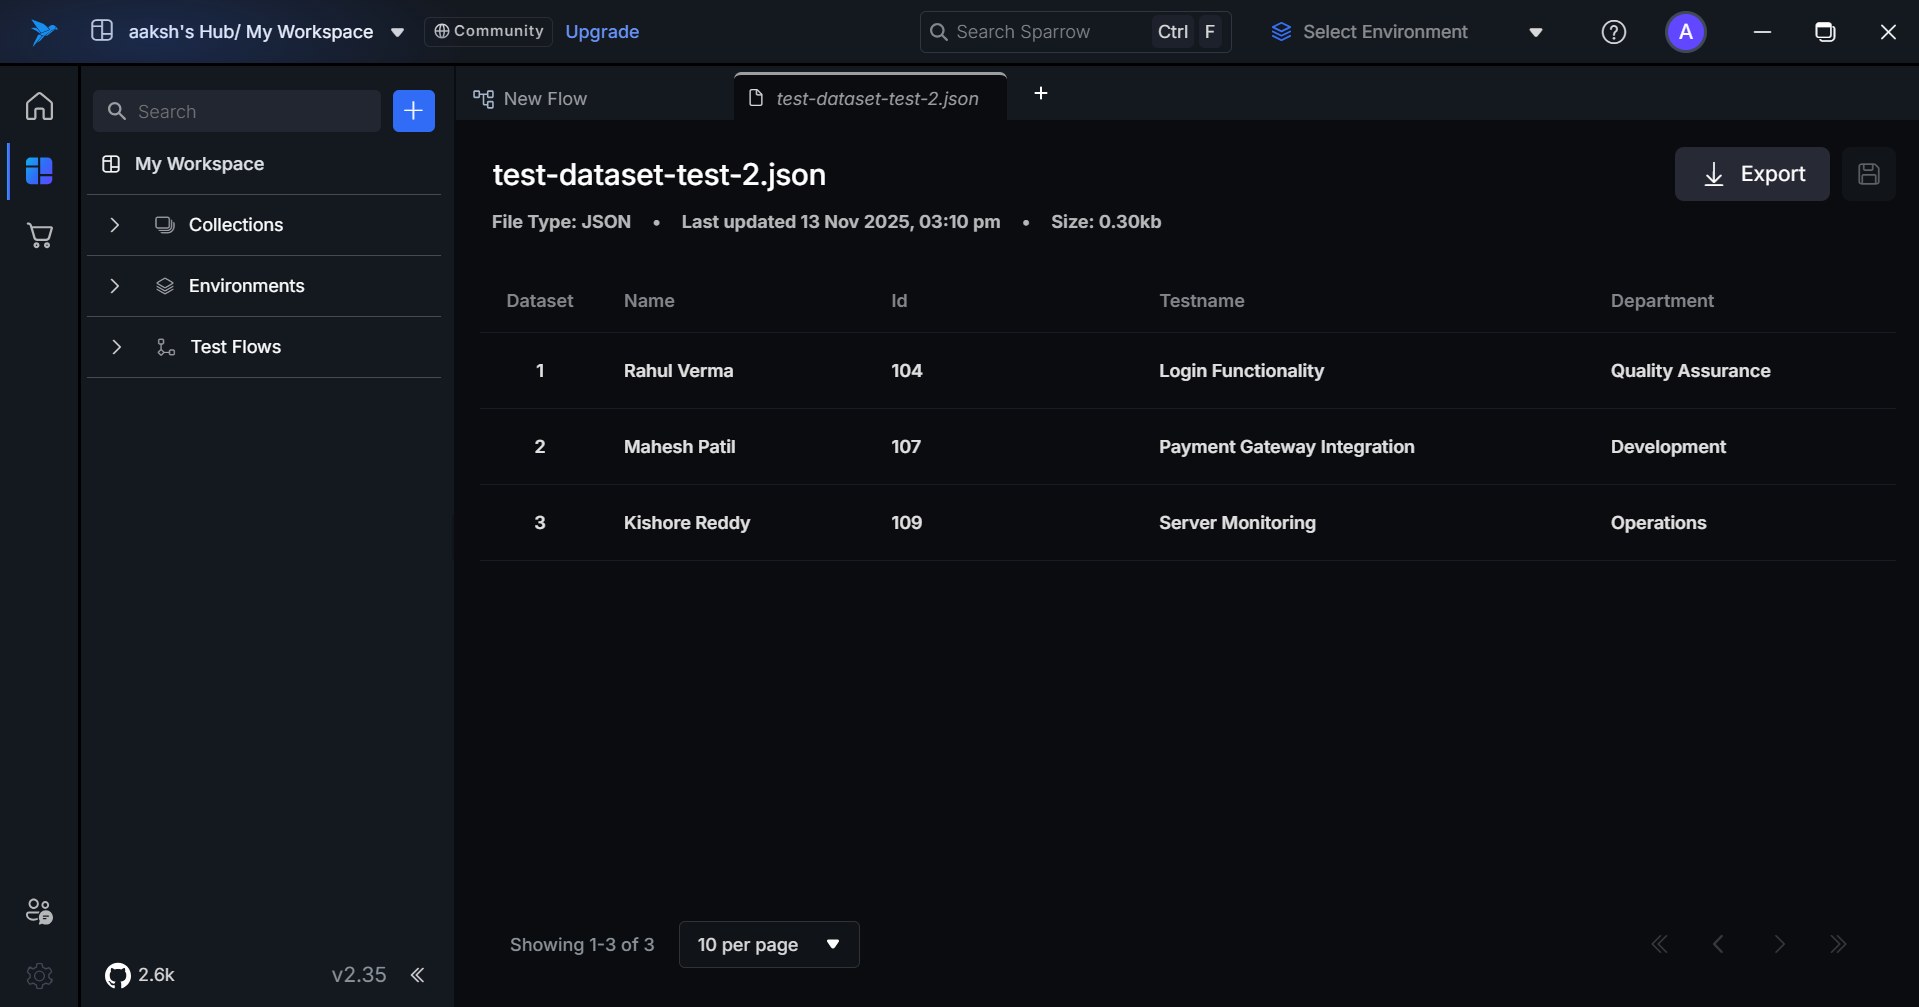
Dataset Detail View
When you click on an individual dataset, the detail view shows:
Schedule Run
Schedule Run for Test Flows = Automated execution of test cases at scheduled times.
Simple definition: Running your test flows automatically at preset intervals instead of manually triggering them each time.
Purpose:
- Run tests regularly (nightly, weekly) to catch issues early
- Automate regression testing
- Continuous testing without manual effort
Examples:
- Run all API tests every night at 12 AM
- Execute smoke tests after every deployment
- Run full test suite every Sunday at 2 AM
Benefits:
- Saves time - no manual test execution
- Consistent testing - never forget to run tests
- Early bug detection - catch issues before production
Adding Test Data
We can also add test data. Each dataset item represents a complete test run, containing variable key-value pairs that dynamically replace placeholders within the Test Flow nodes.
Variable Substitution
During TestFlow execution:
When a node contains placeholders in its configuration (e.g. headers, URL, or request body), placeholders are wrapped in double curly braces:
{{variableName}}
The system replaces these placeholders with values from the current dataset item.
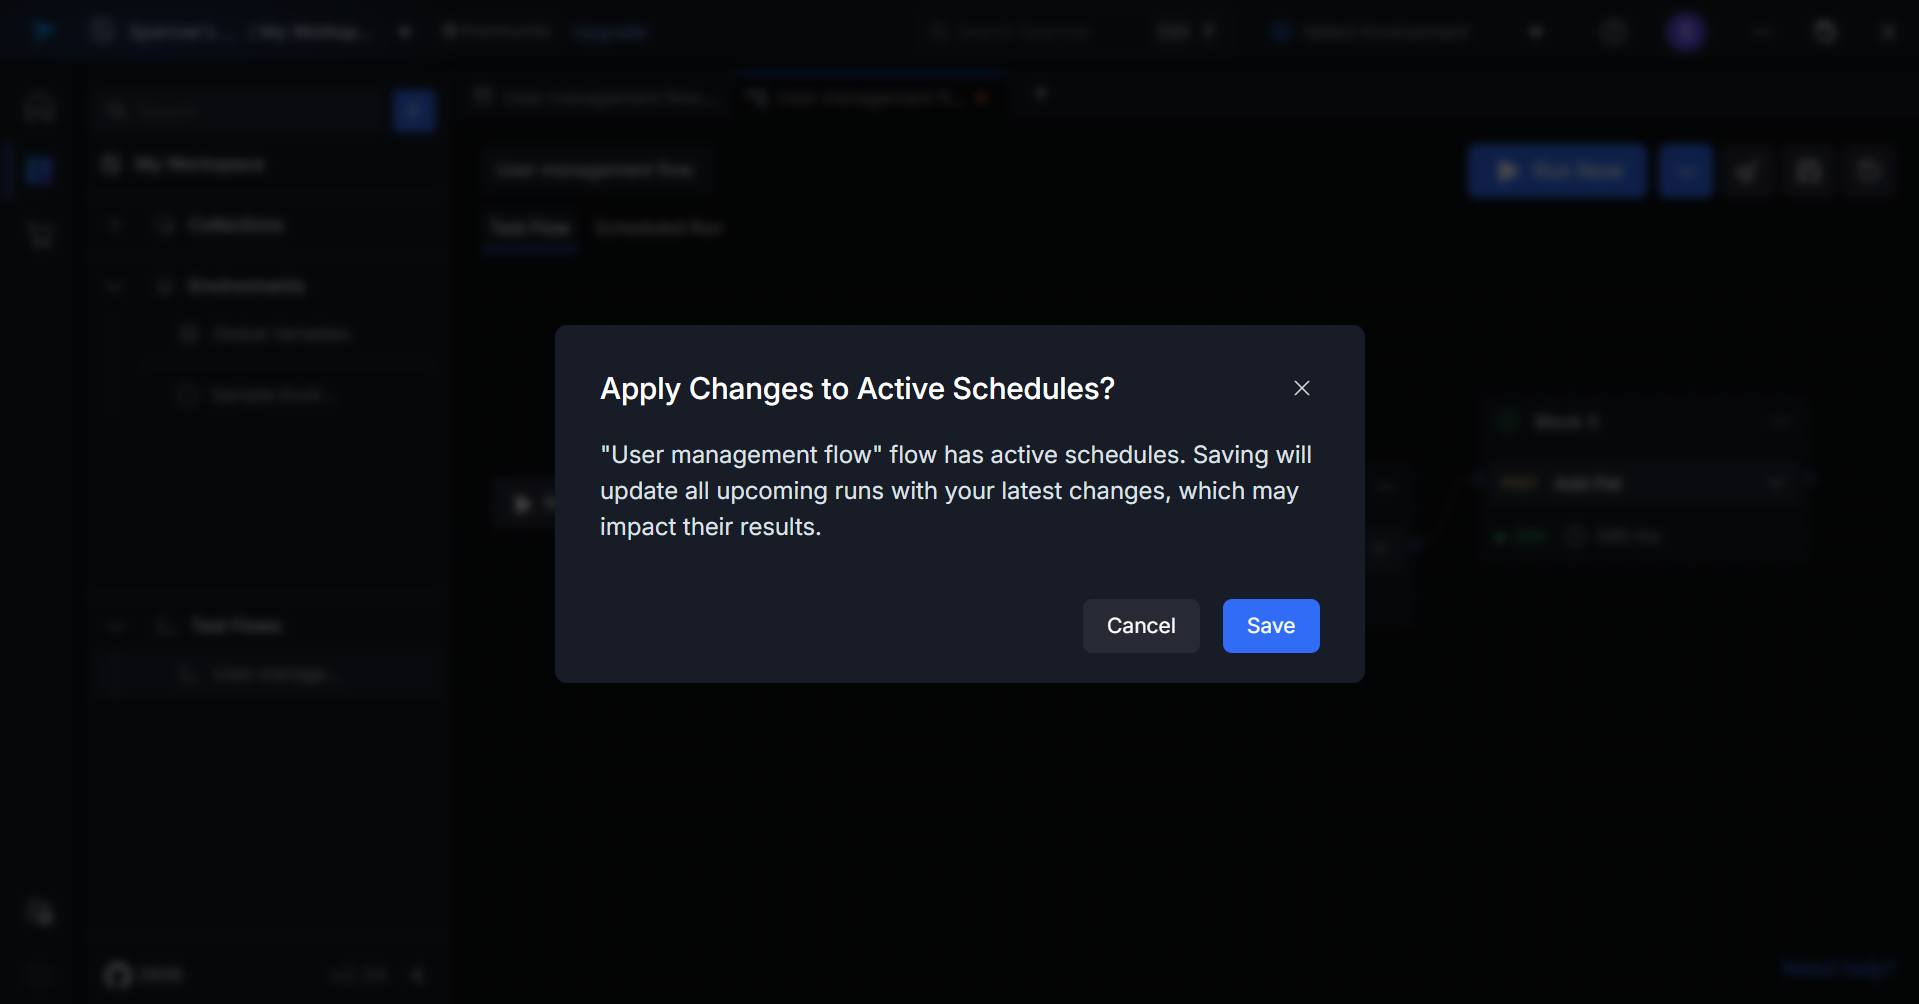
Auto-Update: Test Flow Changes Apply to Scheduled Runs
Click on the Test Flow you wanted to change. If a test flow has an active schedule, A pop up appears, the changes made in the Test flow and on confirmation, it affects your Active schedules.
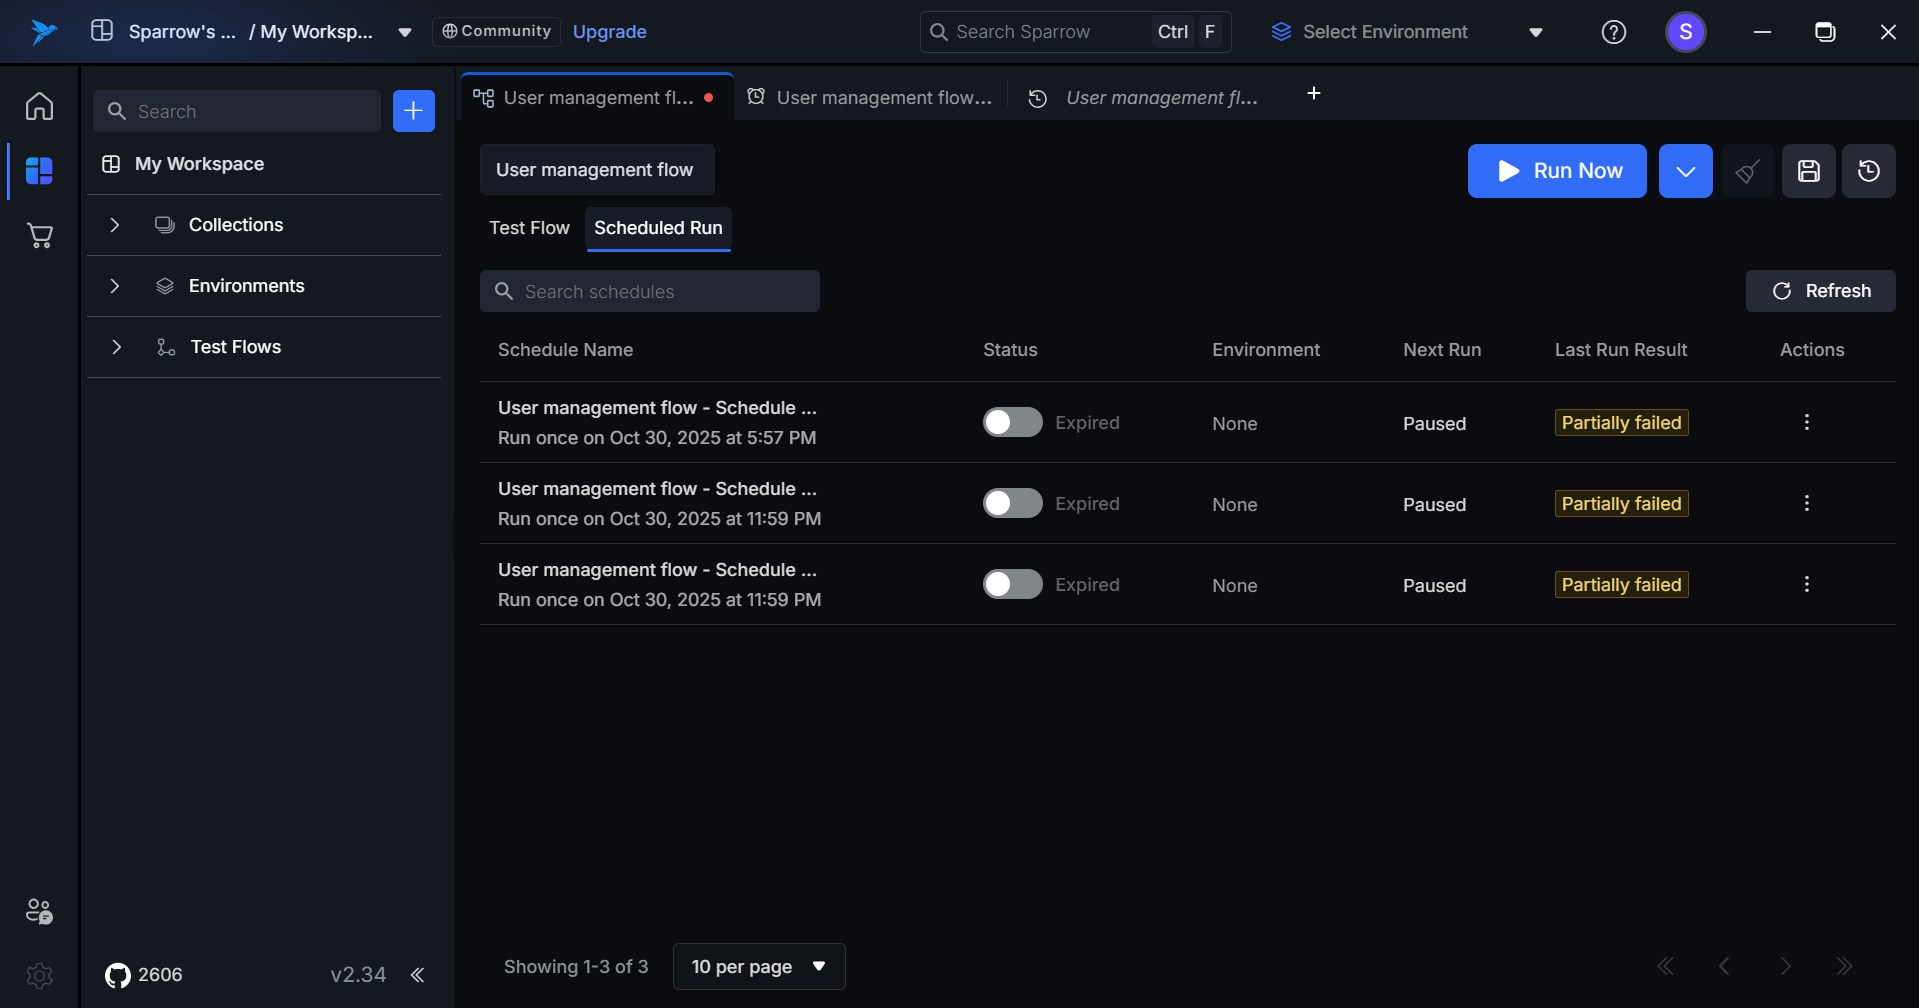
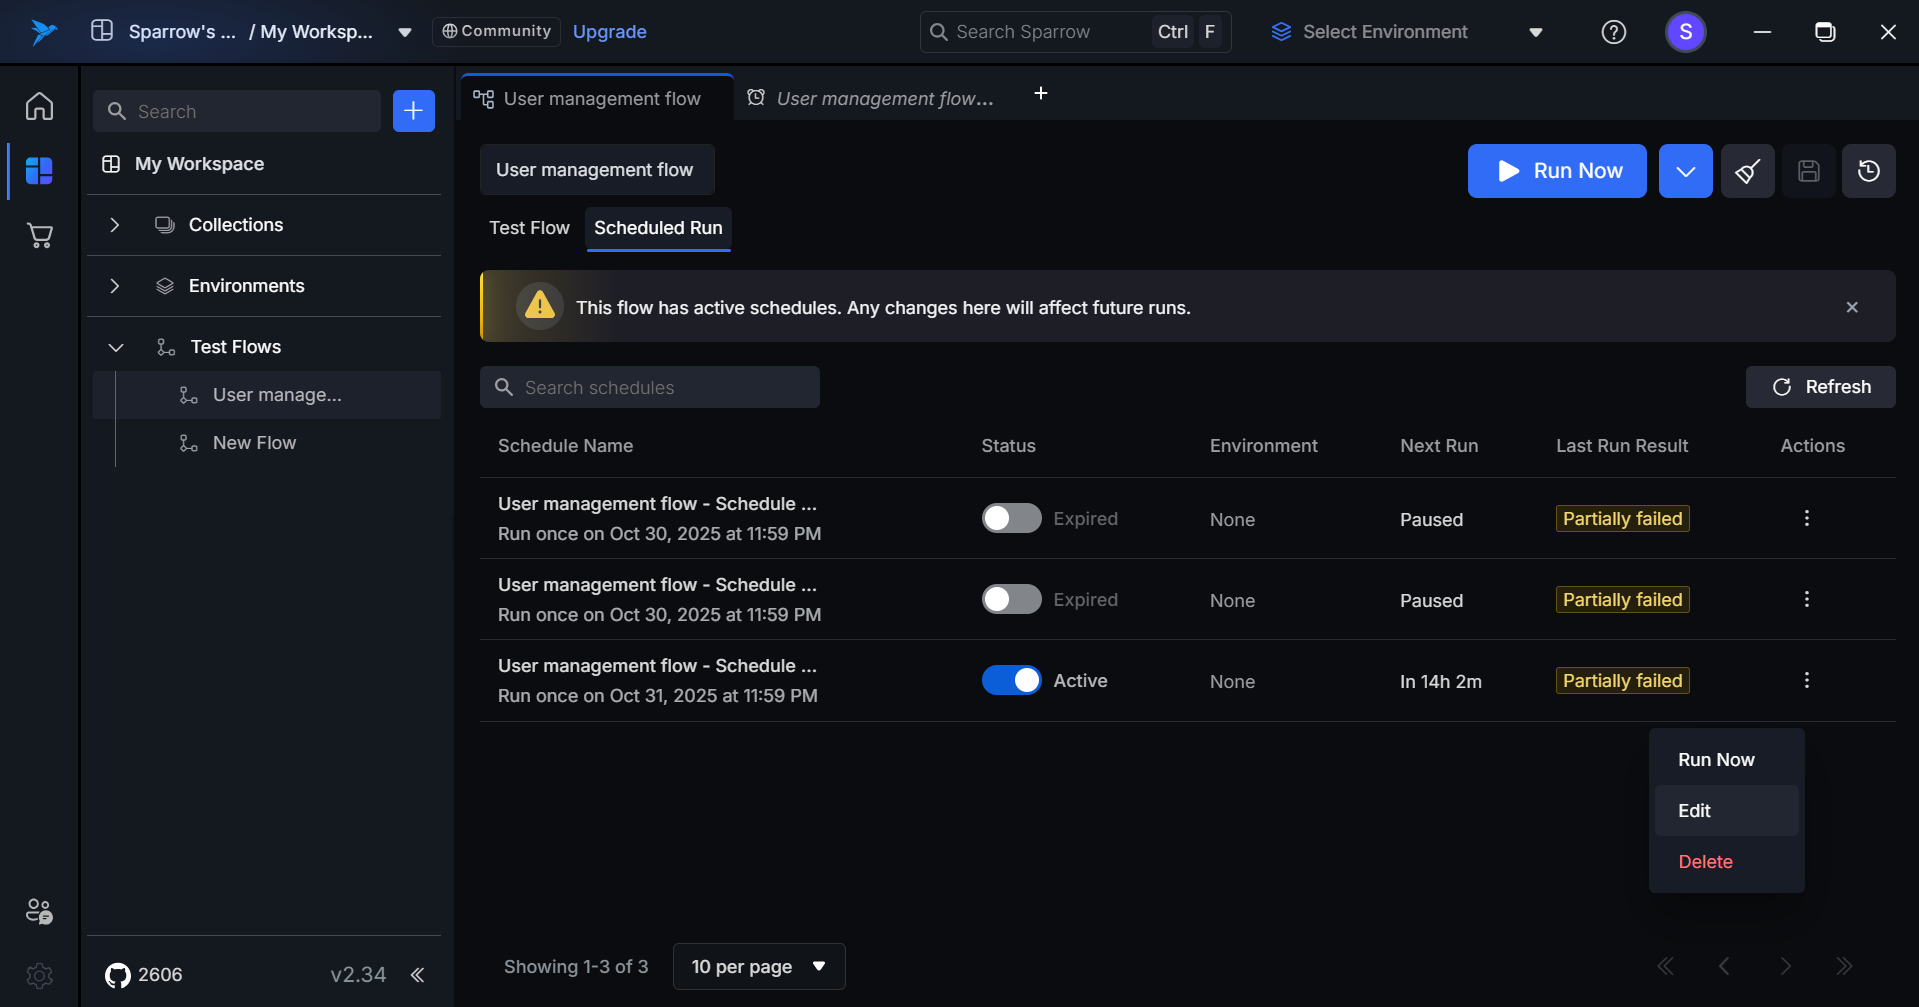
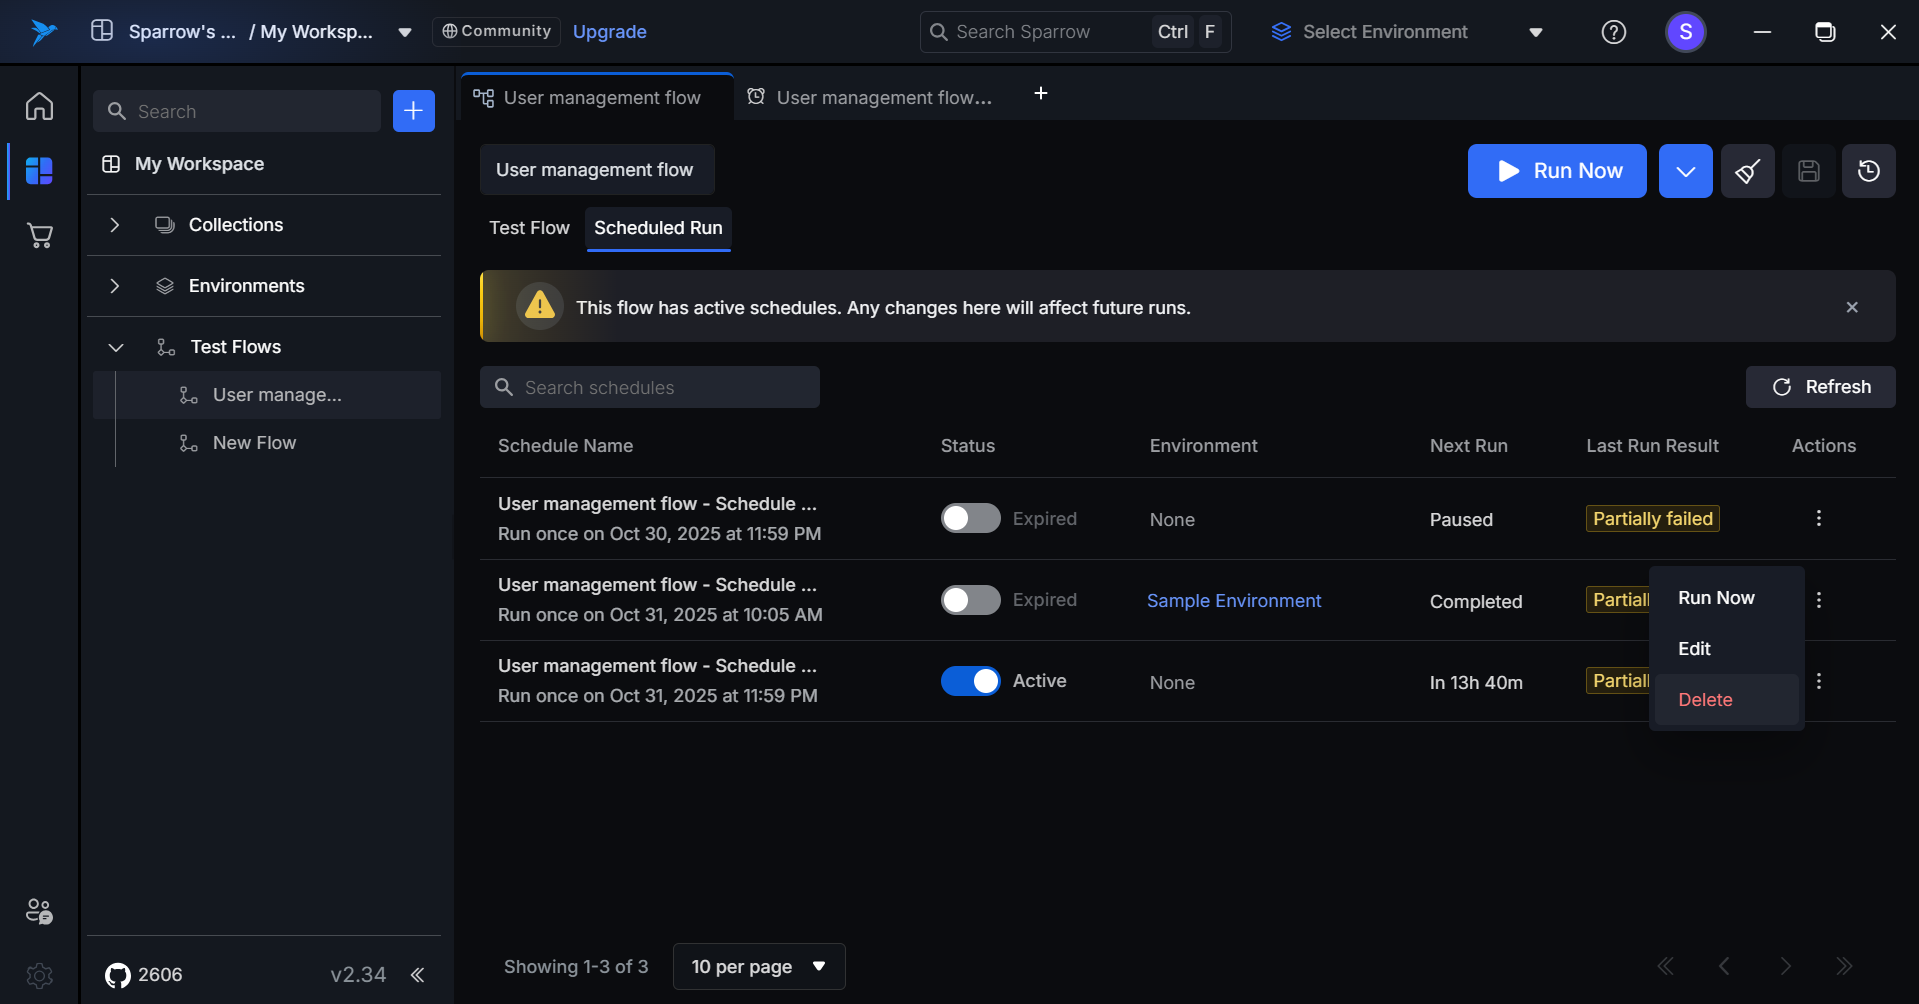
View Scheduled runs
Click on the Scheduled run to see the list of all the runs scheduled by the user.
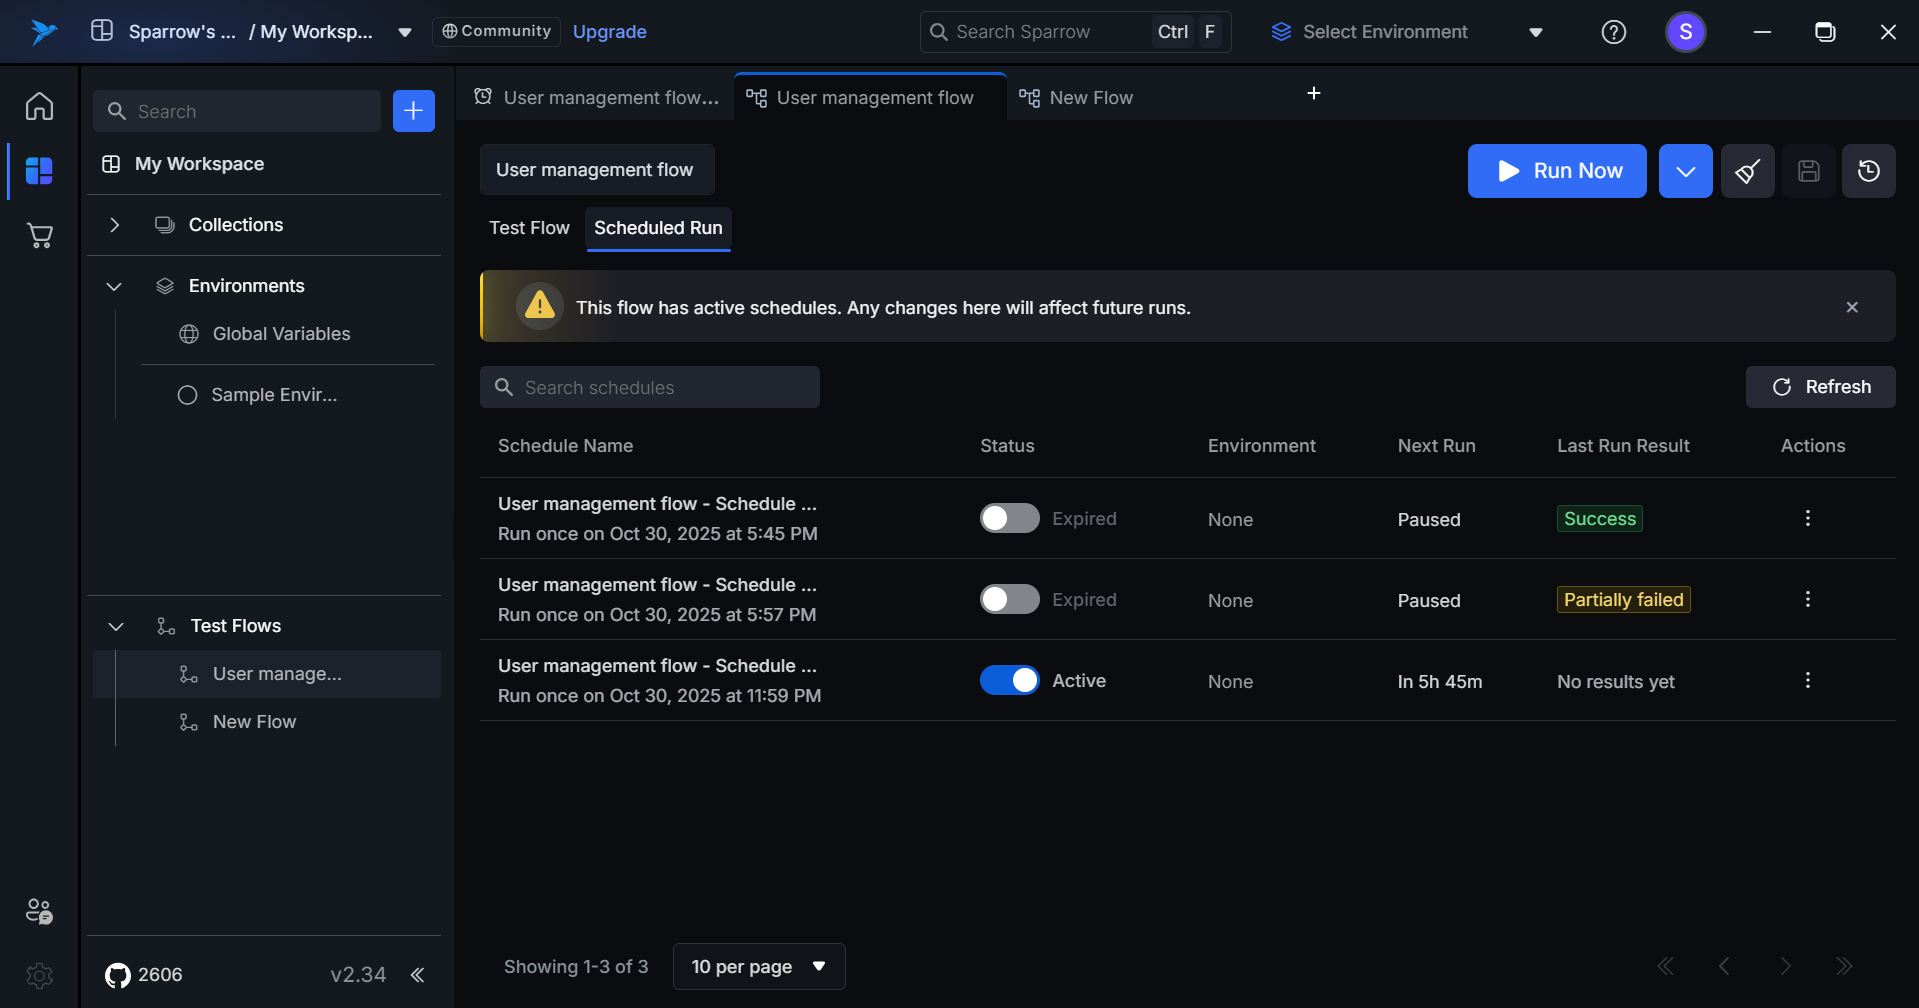
Details Regarding the List
Schedule Name
Displays the schedule name along with its run frequency details.
Example: “Daily Regression Tests – Runs every 2 hours”
Status
An Active/Inactive toggle that enables or disables the schedule without permanently deleting it.
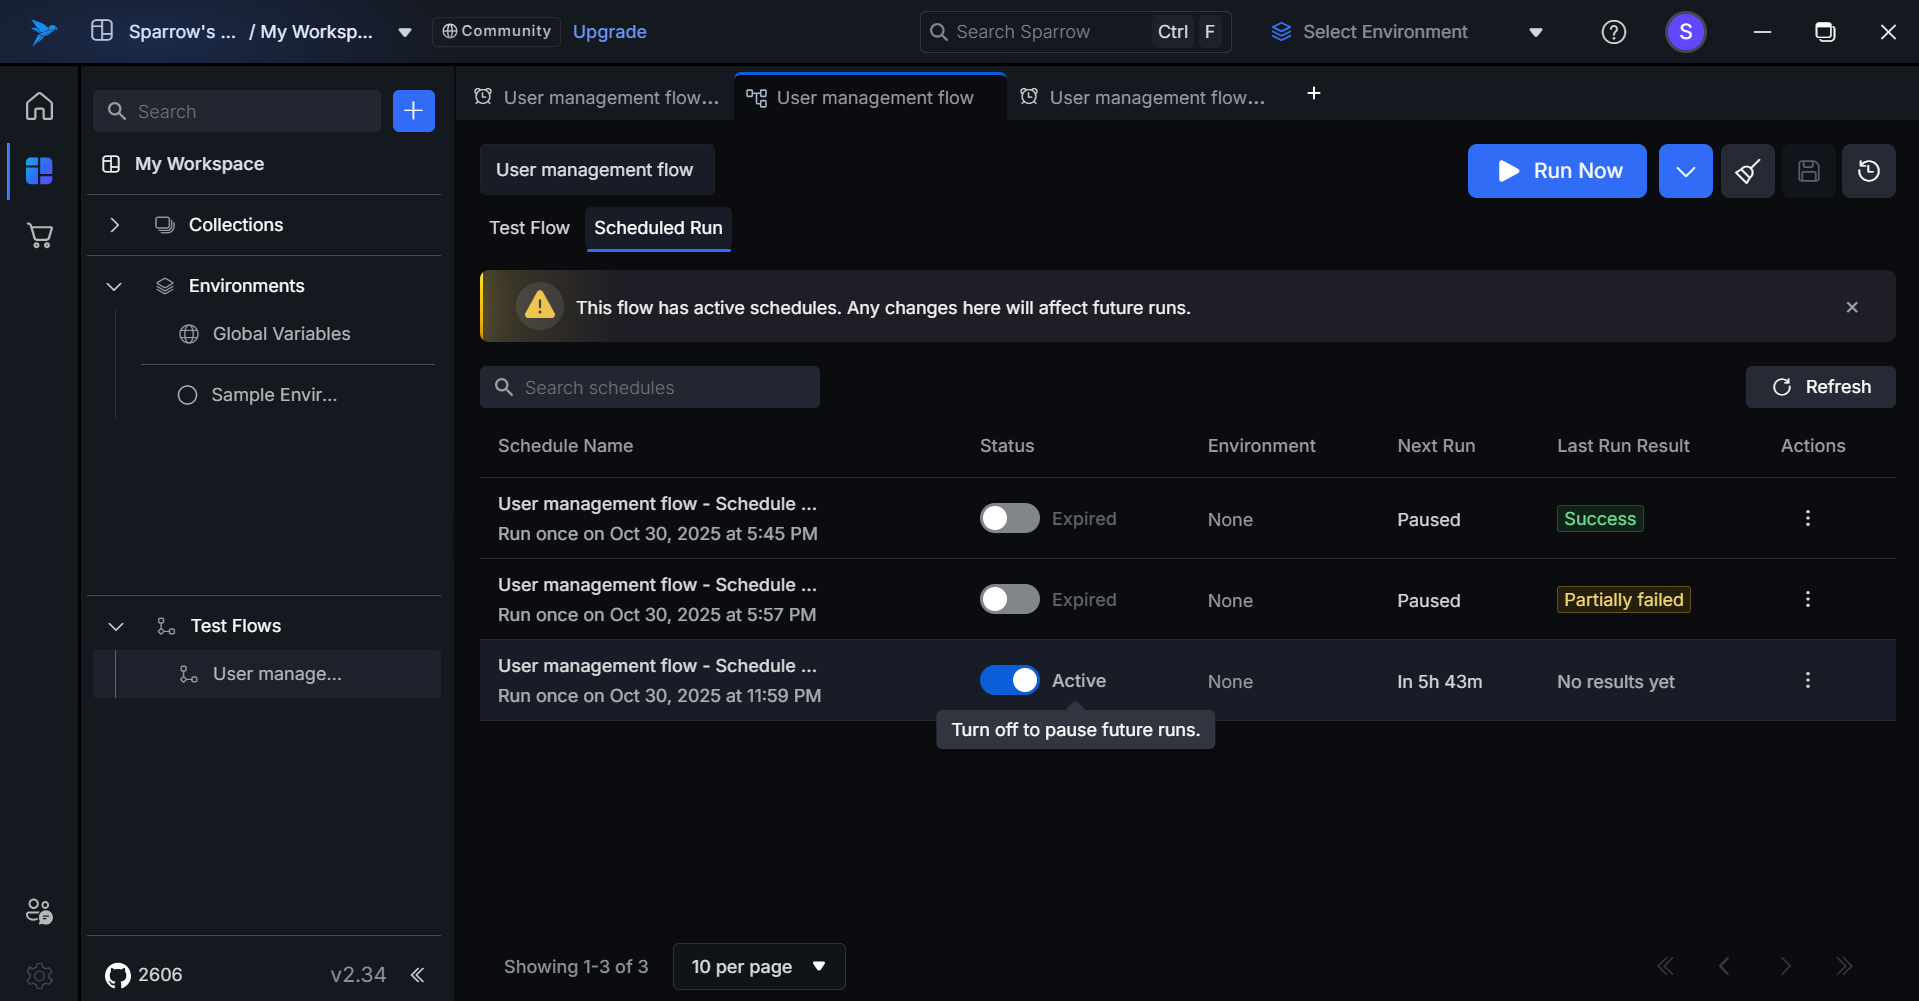
Active
- Toggle: Switch is ON (enabled)
- Indicator: Shows the schedule is currently running and will execute at scheduled times
- Tooltip (on hover): “Turn off to pause future runs”
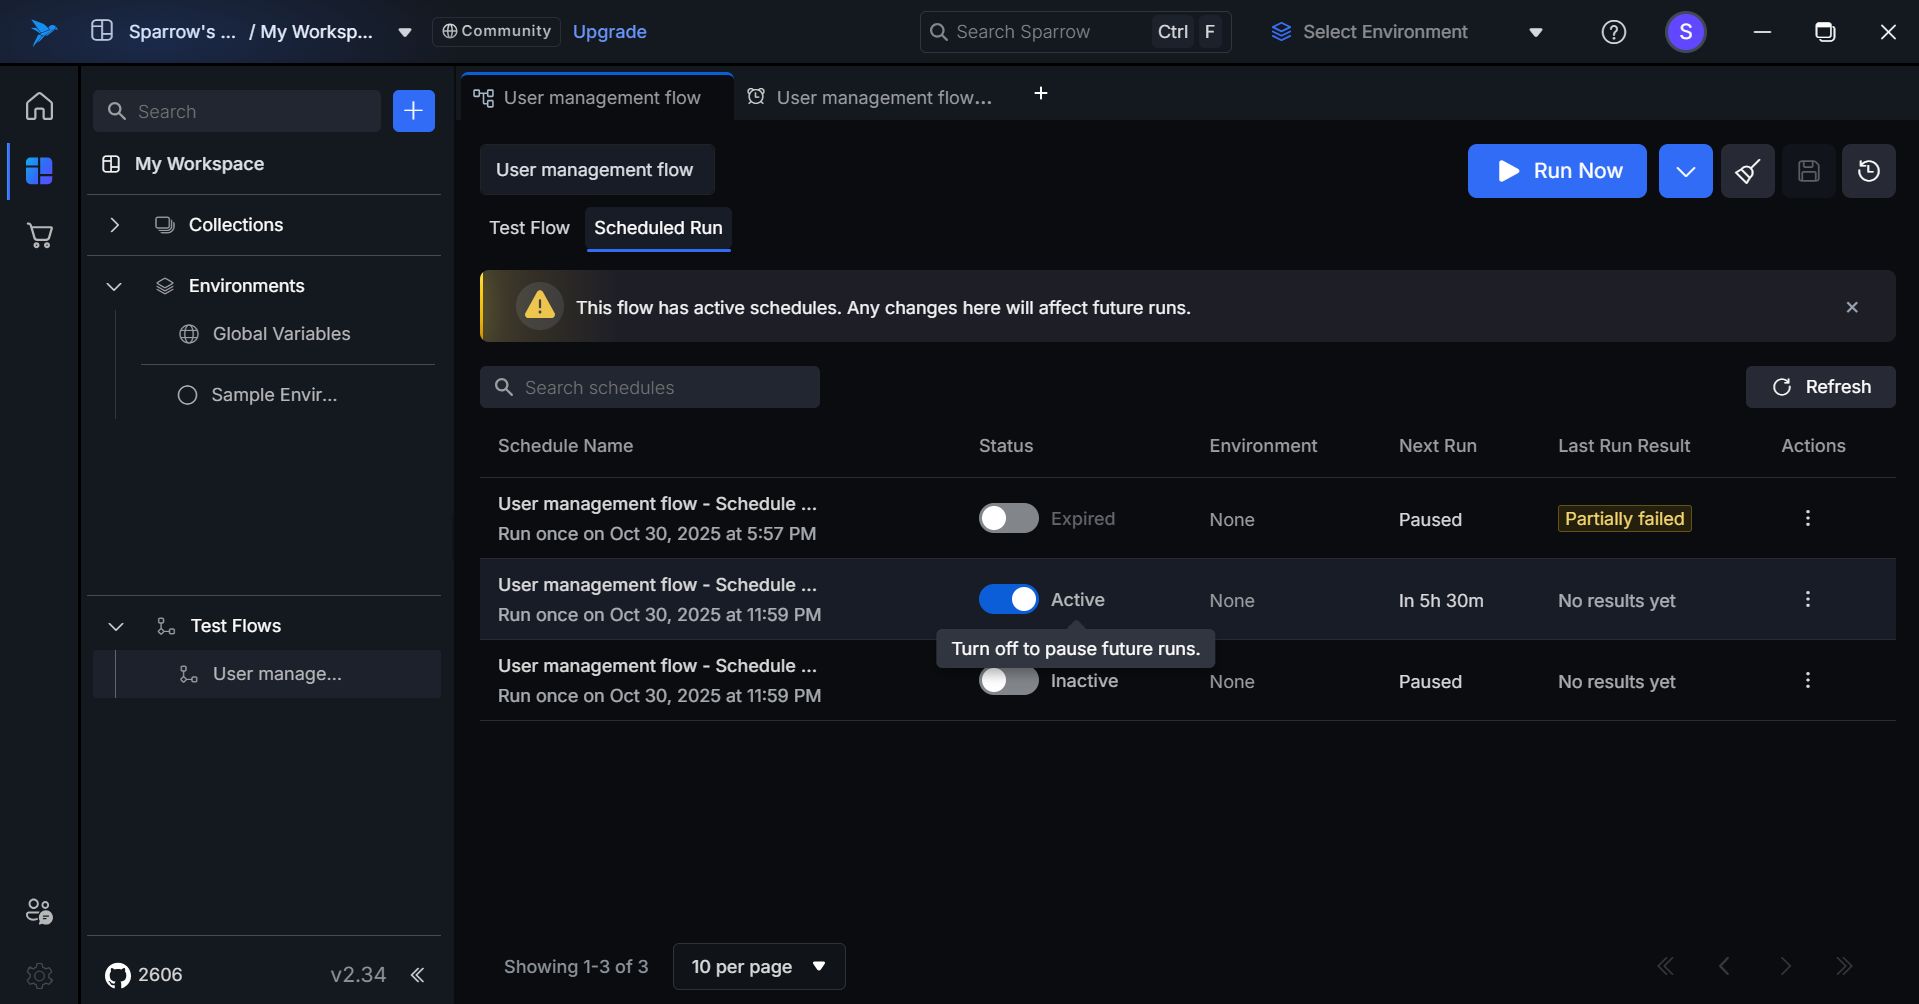
Inactive (Paused)
- Toggle: Switch is OFF (enabled but turned off)
- Indicator: Row remains visible with “Paused” status displayed in subtle grey tone
- Tooltip (on hover): “Turn on to resume future runs”
- Behavior: Schedule is temporarily disabled but can be reactivated at any time
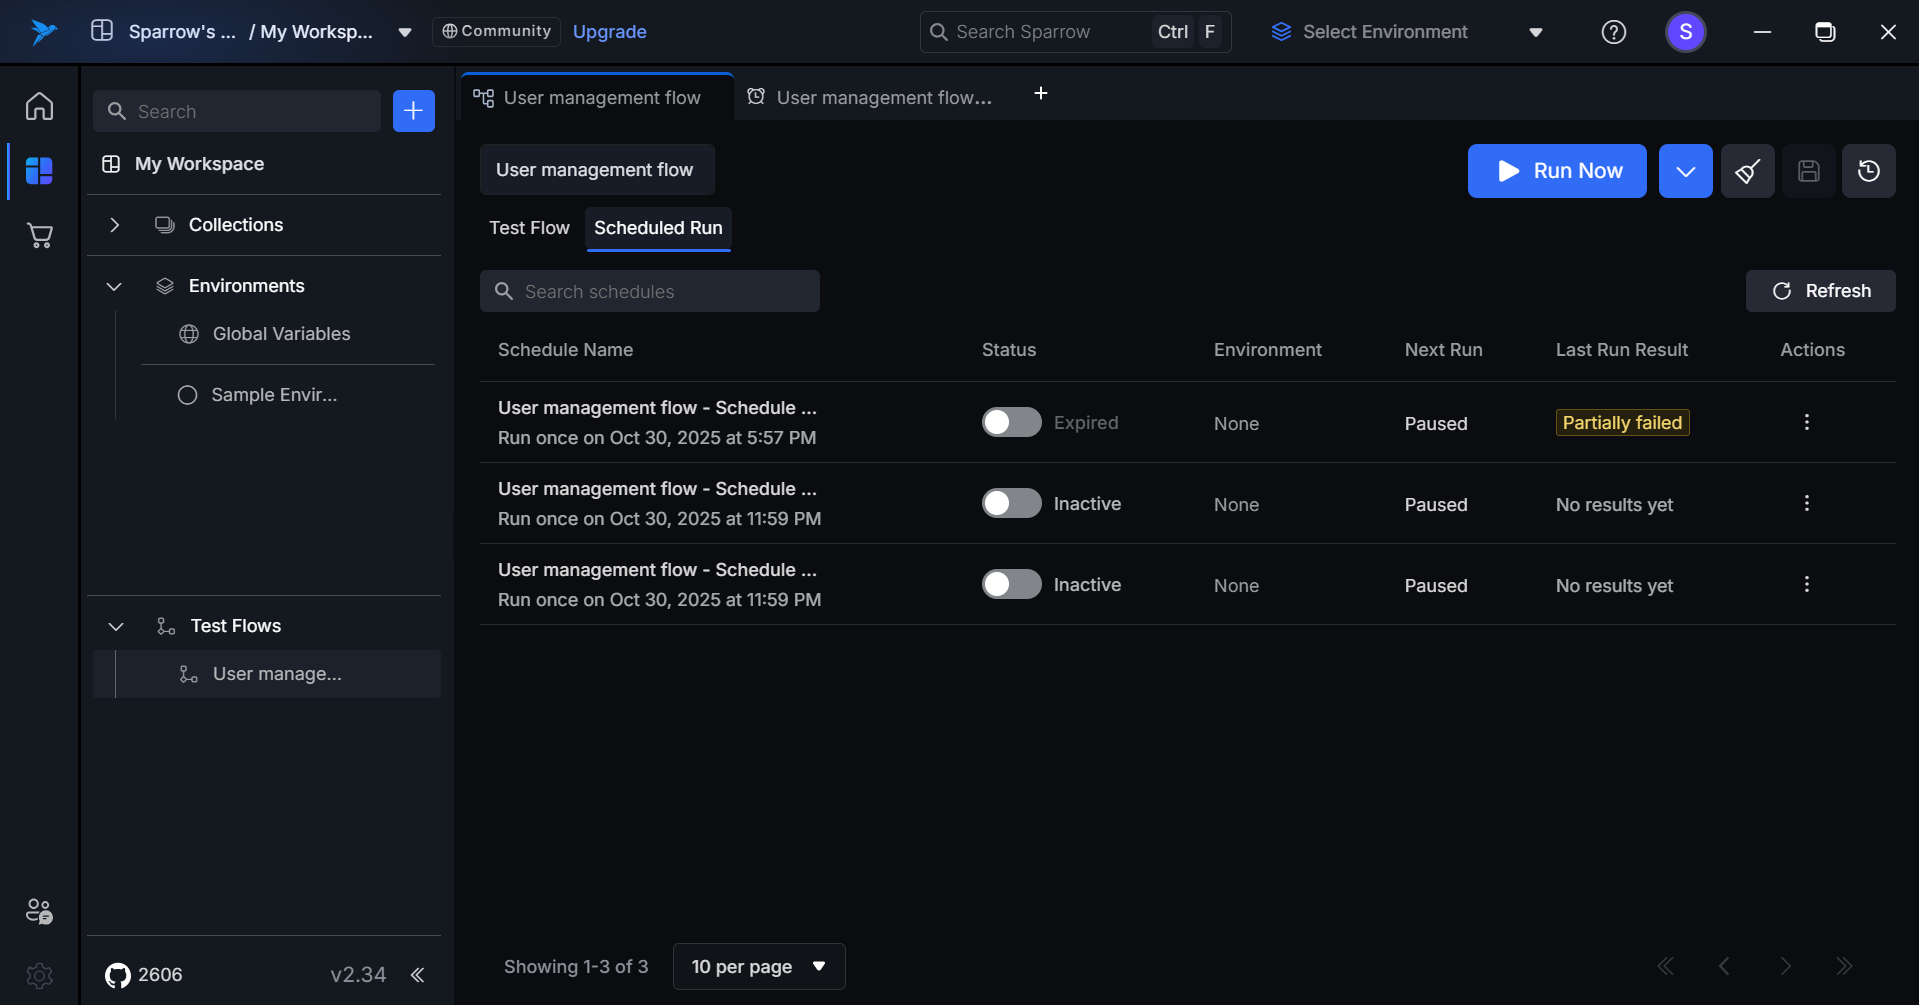
Expired (Completed)
- Toggle: Switch is disabled and greyed out (non-interactive)
- Indicator: Displays “Completed” status in muted color
- Tooltip (on hover): “This schedule has completed all its runs and cannot be reactivated”
- Behavior: One-time schedules that have already executed cannot be resumed or modified
Environment
An environment is a configuration set that defines variables, base URLs, and settings for executing API requests in different contexts such as development, staging, or production.
Normal State
- Displays the selected environment name
No Environment
- Displays “None” in muted text
- Indicates no environment has been configured for this schedule
Next Run
Displays the scheduled time for the upcoming test execution.
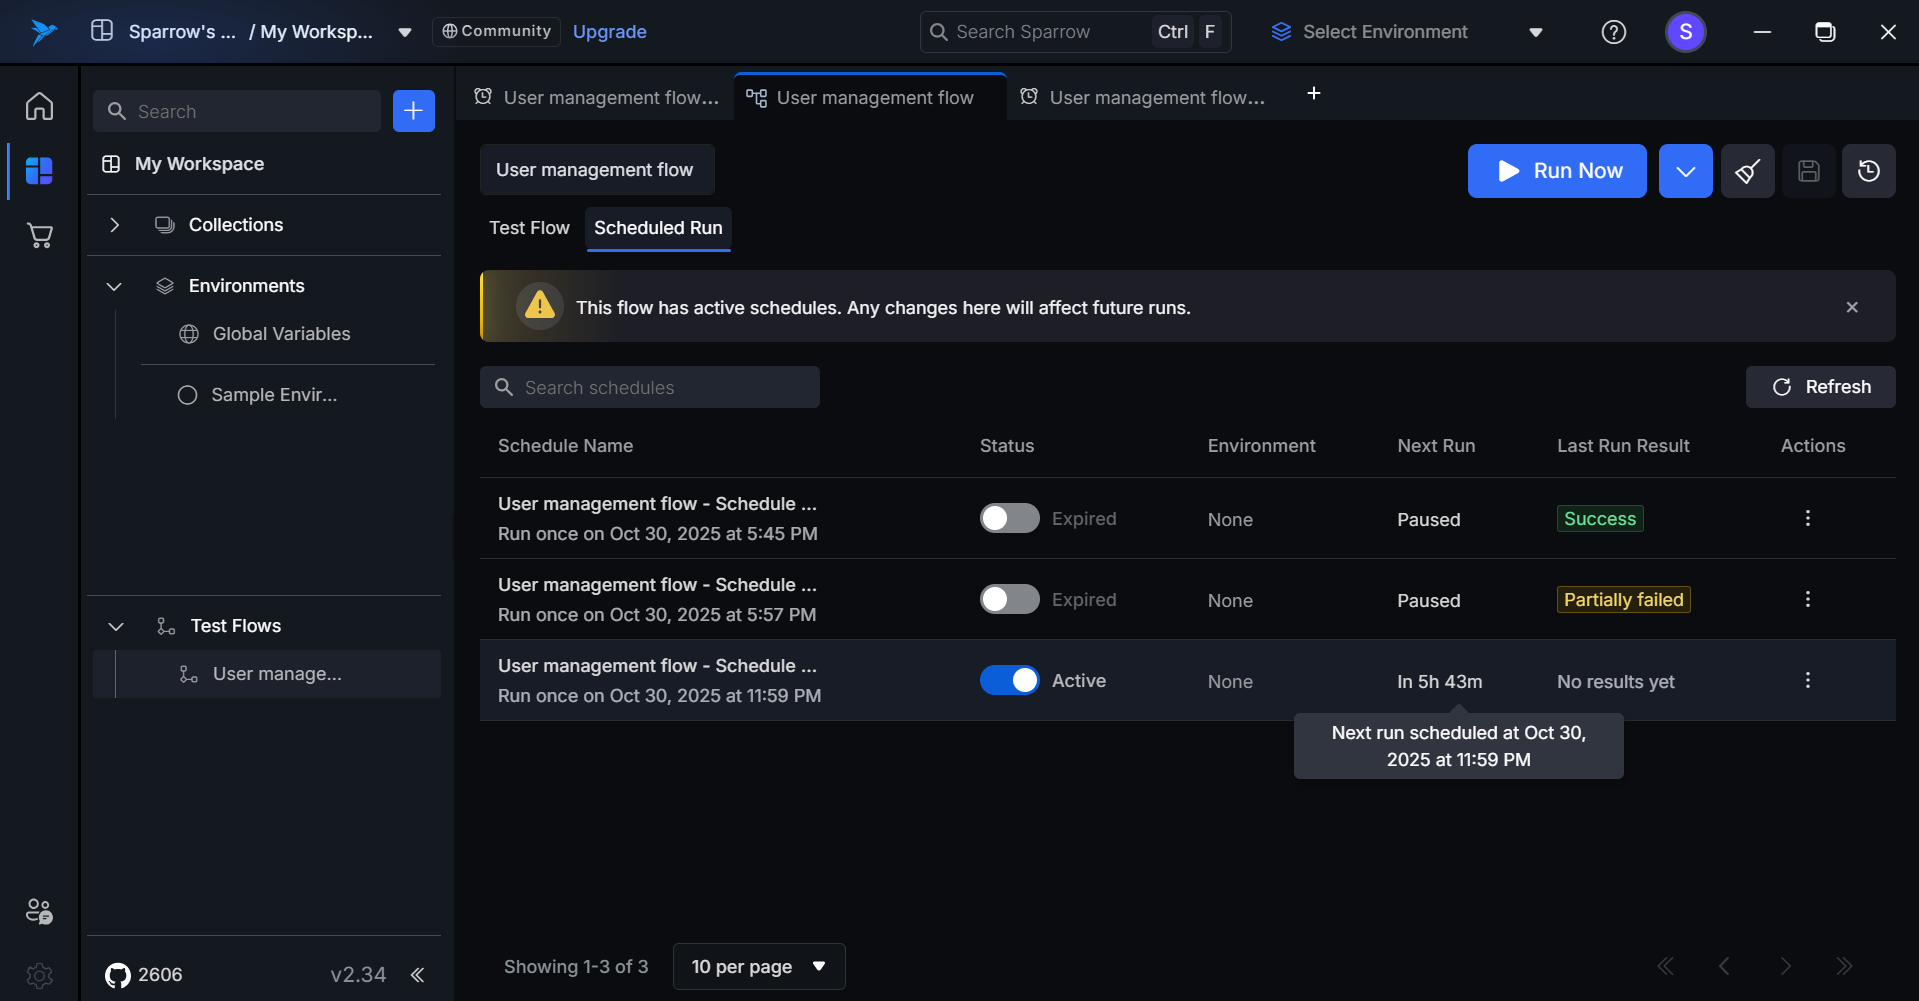
Active Schedule
- Shows the upcoming run time with date and time details
Example: “Today, 3:30 PM” or “Oct 2, 2025, 10:00 AM”
Inactive Schedule
- Displays “Paused” status
- Tooltip (on hover): “This schedule is currently paused. Resume to enable future runs.”
Expired Schedule
- Displays “Completed” status
- Tooltip (on hover): “No more runs. Scheduled runs are completed after last run on Sep 8, 2025, 4:00 PM.”
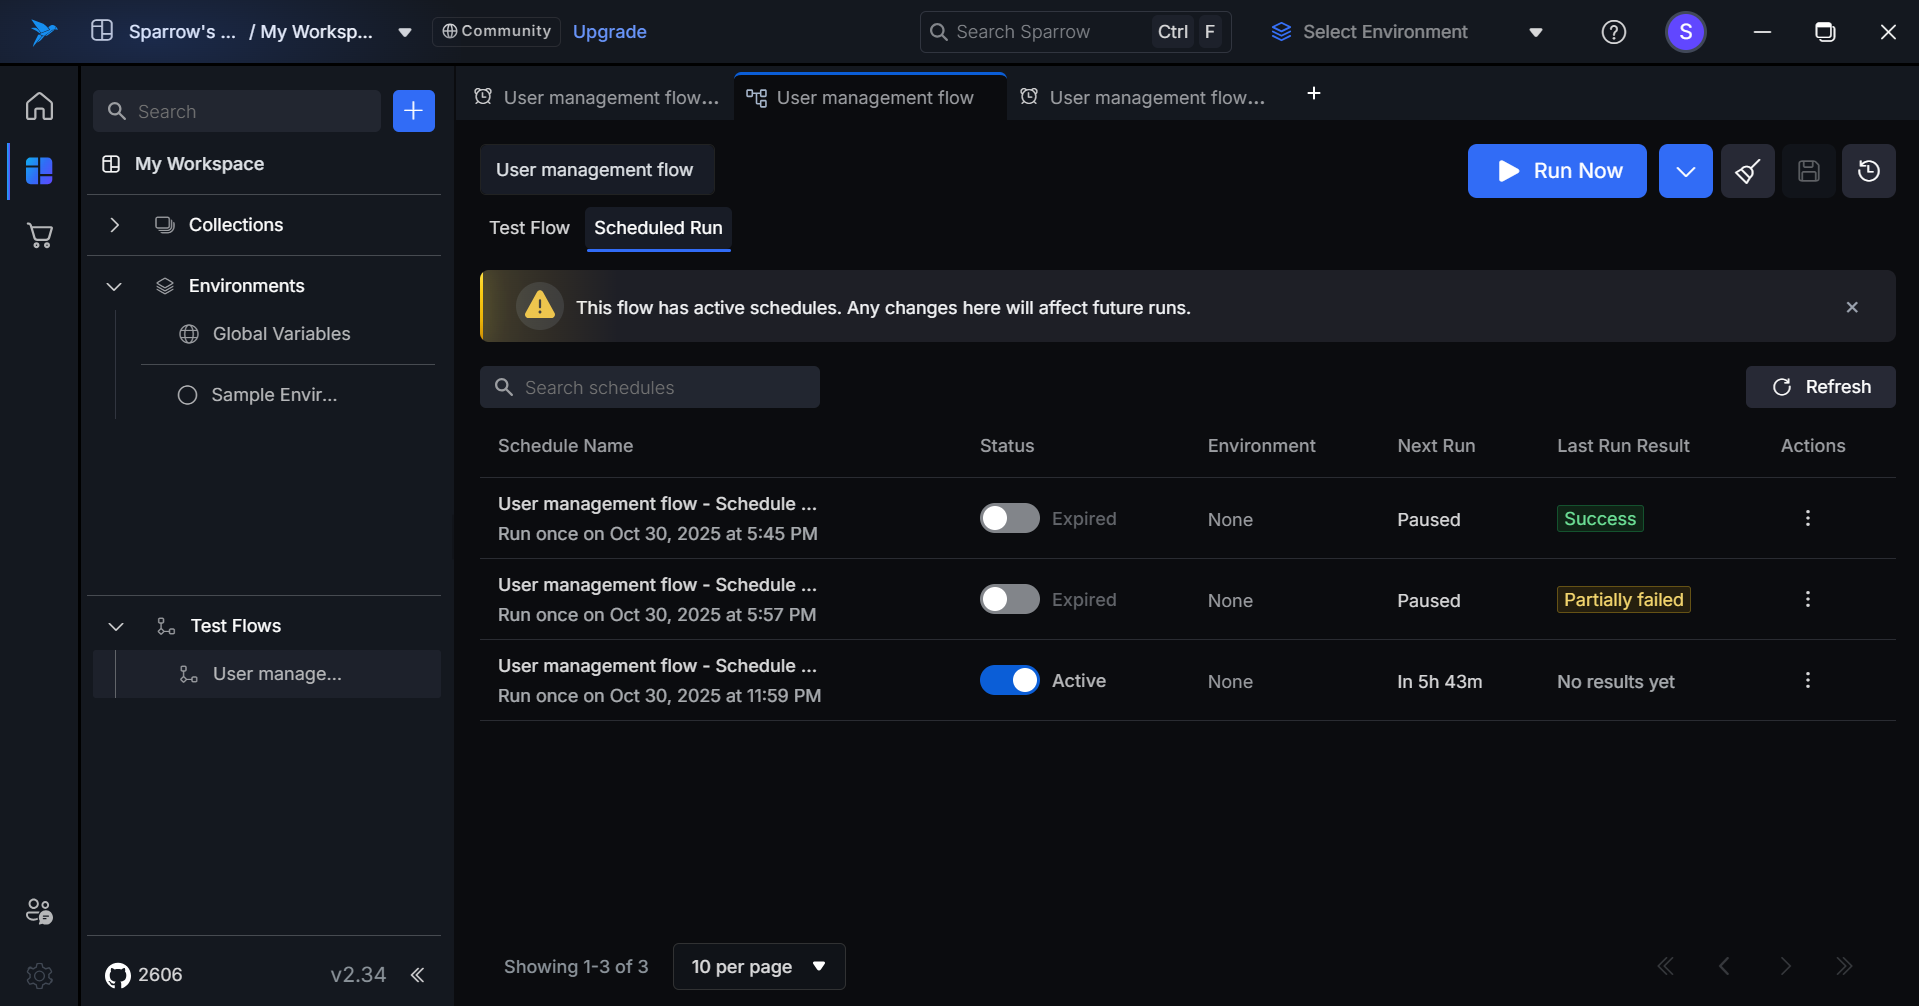
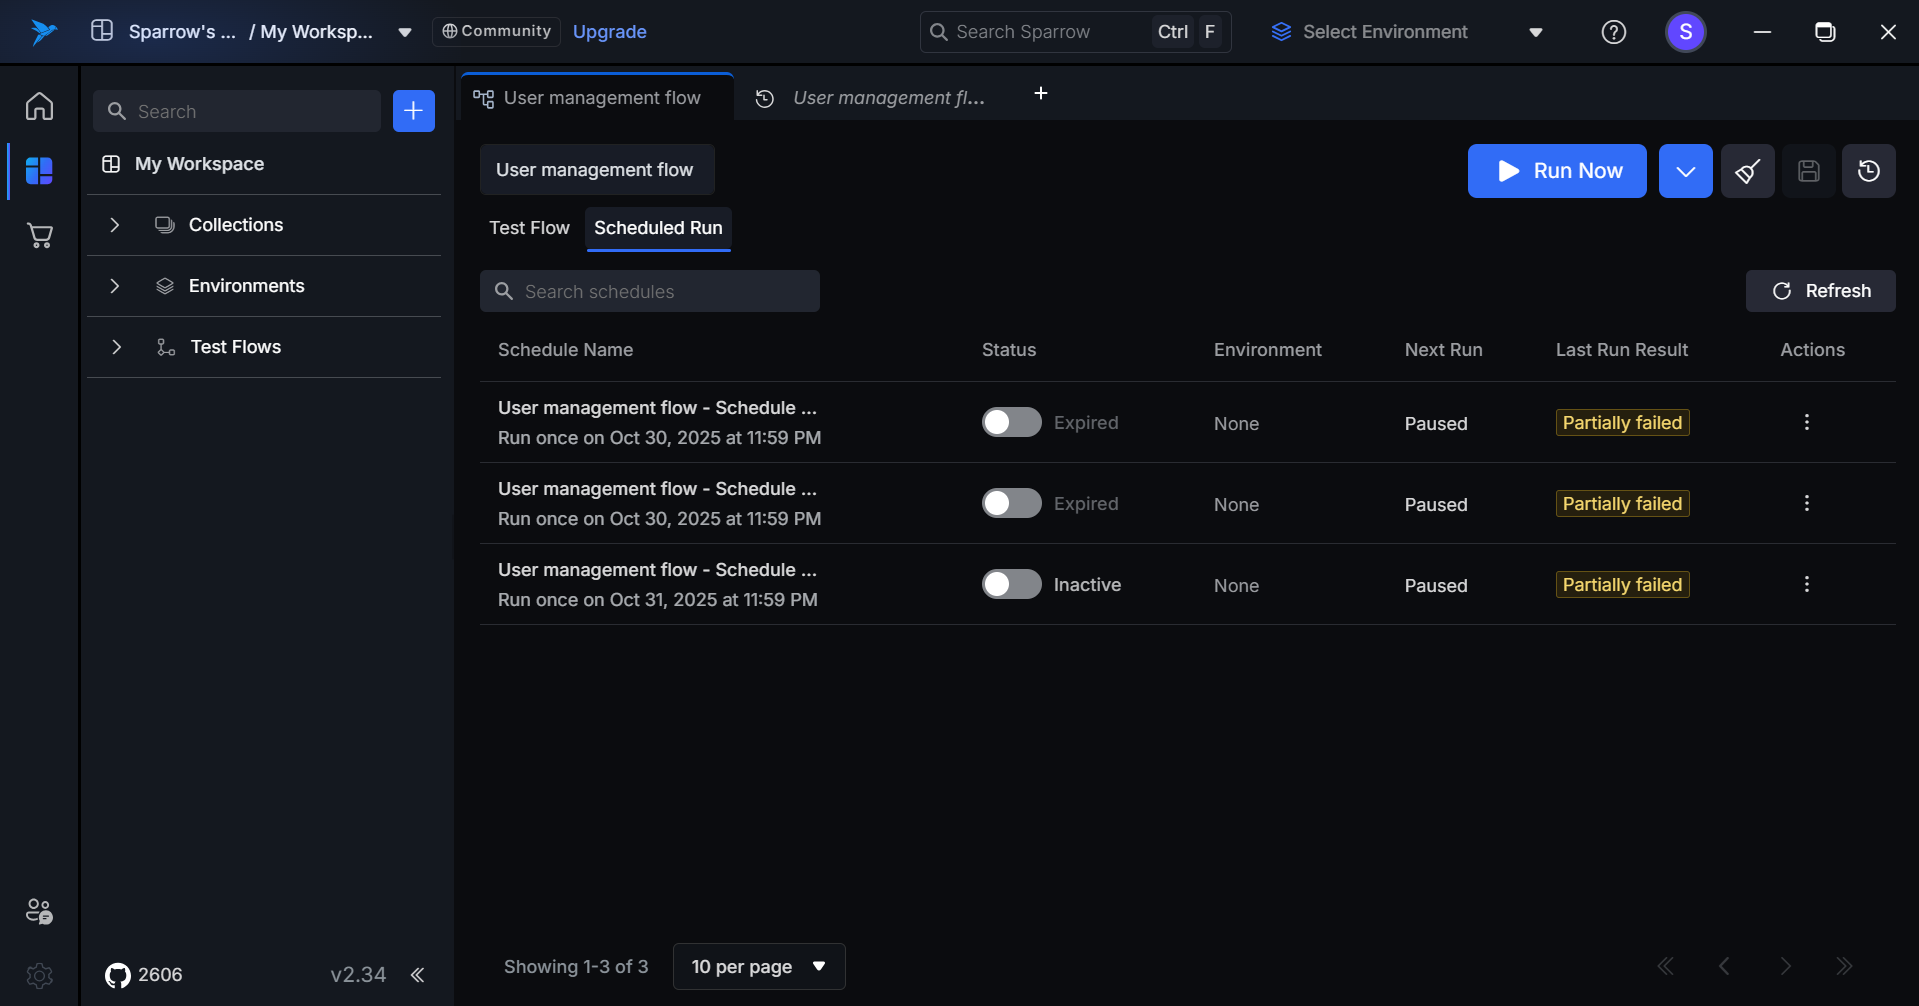
Last Run Result
Displays a quick summary of the most recent test execution with color-coded status indicators.
Status Indicators
Passed
- Indicates all tests passed in the last run
- Display: Green tag with “Passed” label
Failed
- Indicates all tests failed in the last run
- Display: Orange tag with “Failed” label
Partially Failed
- Indicates some tests passed while others failed
- Display: Yellow tag with “Partially Failed” label
Error
- Run failed due to execution error, not test failure
- Display: Red/error tag with “Error” label
- Tooltip: “Run did not complete due to an execution error”
Additional Information
Hover Behavior
Hovering over any last run result displays a tooltip with deeper insights including:
- Success/failure count breakdown
- Average response time
Shows a quick summary of the most recent test execution with success or failure indicators.
Hover for detailed insights:
- Success/failure counts
- Average response time
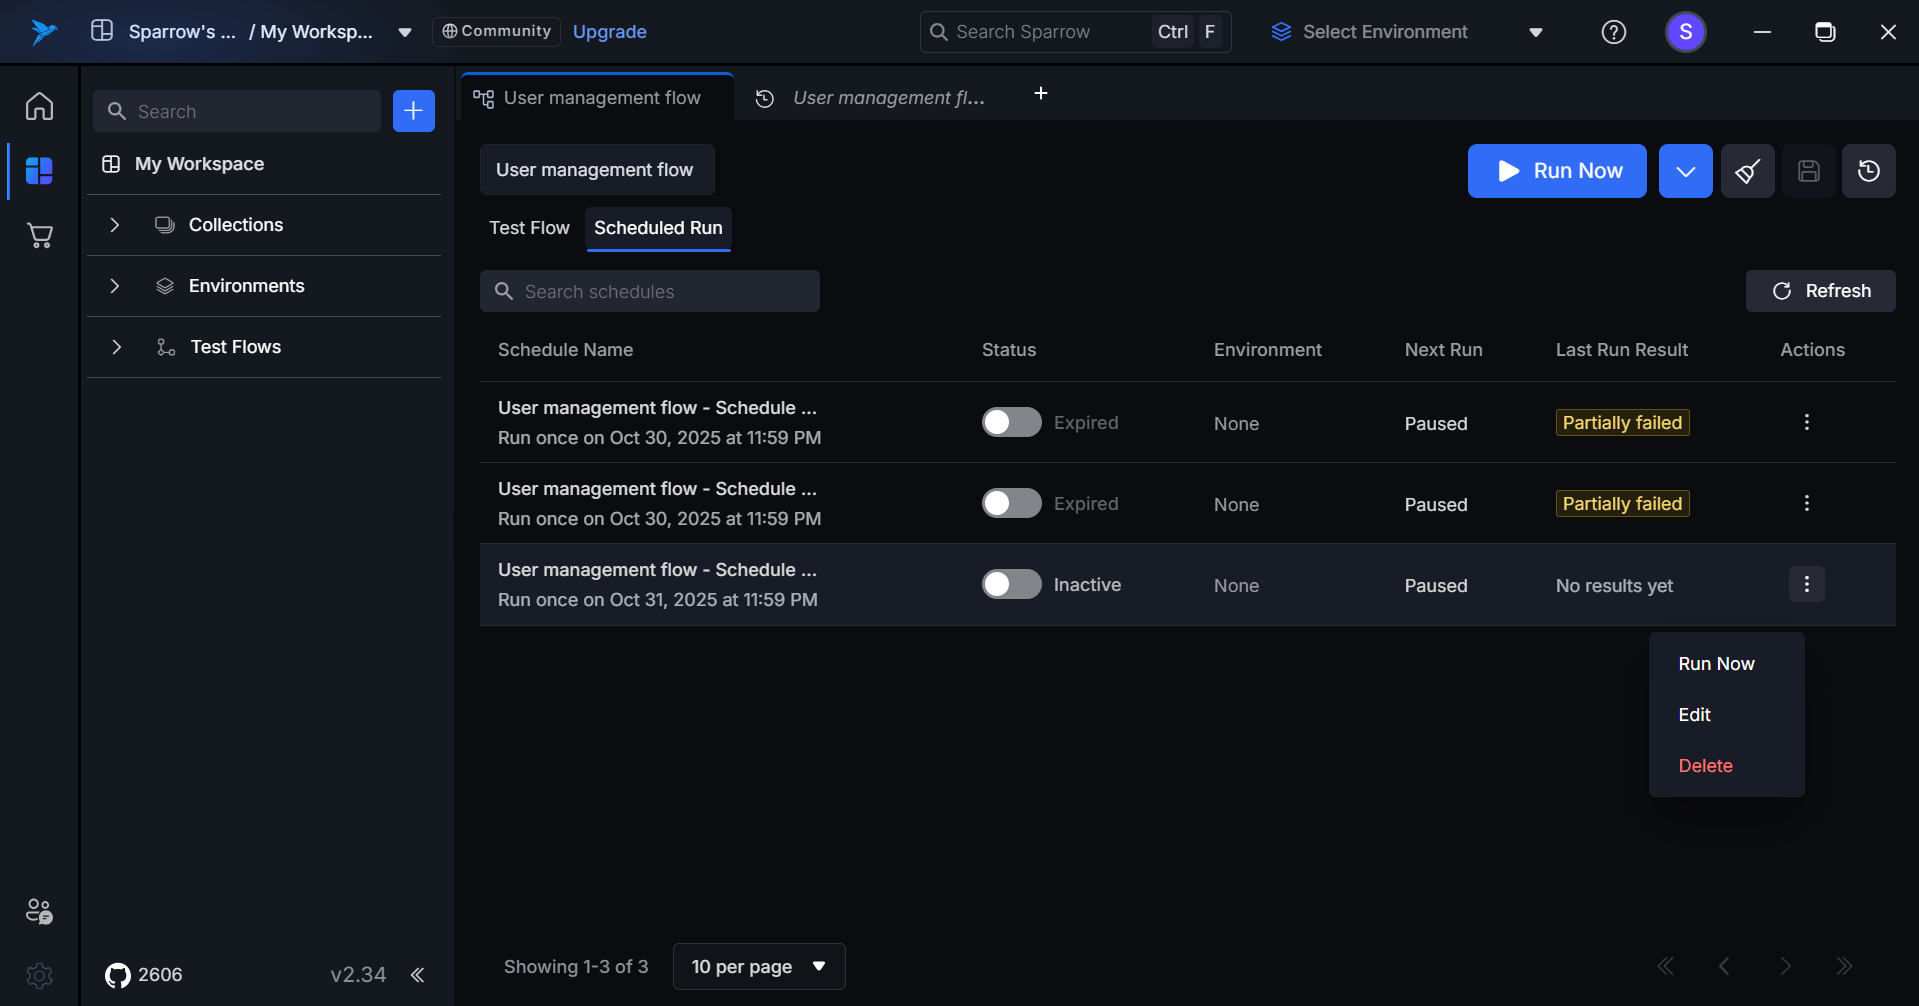
Actions
Scheduled Run Actions allow users to manage their scheduled runs through the Actions button (Run Now, Edit, or Delete).
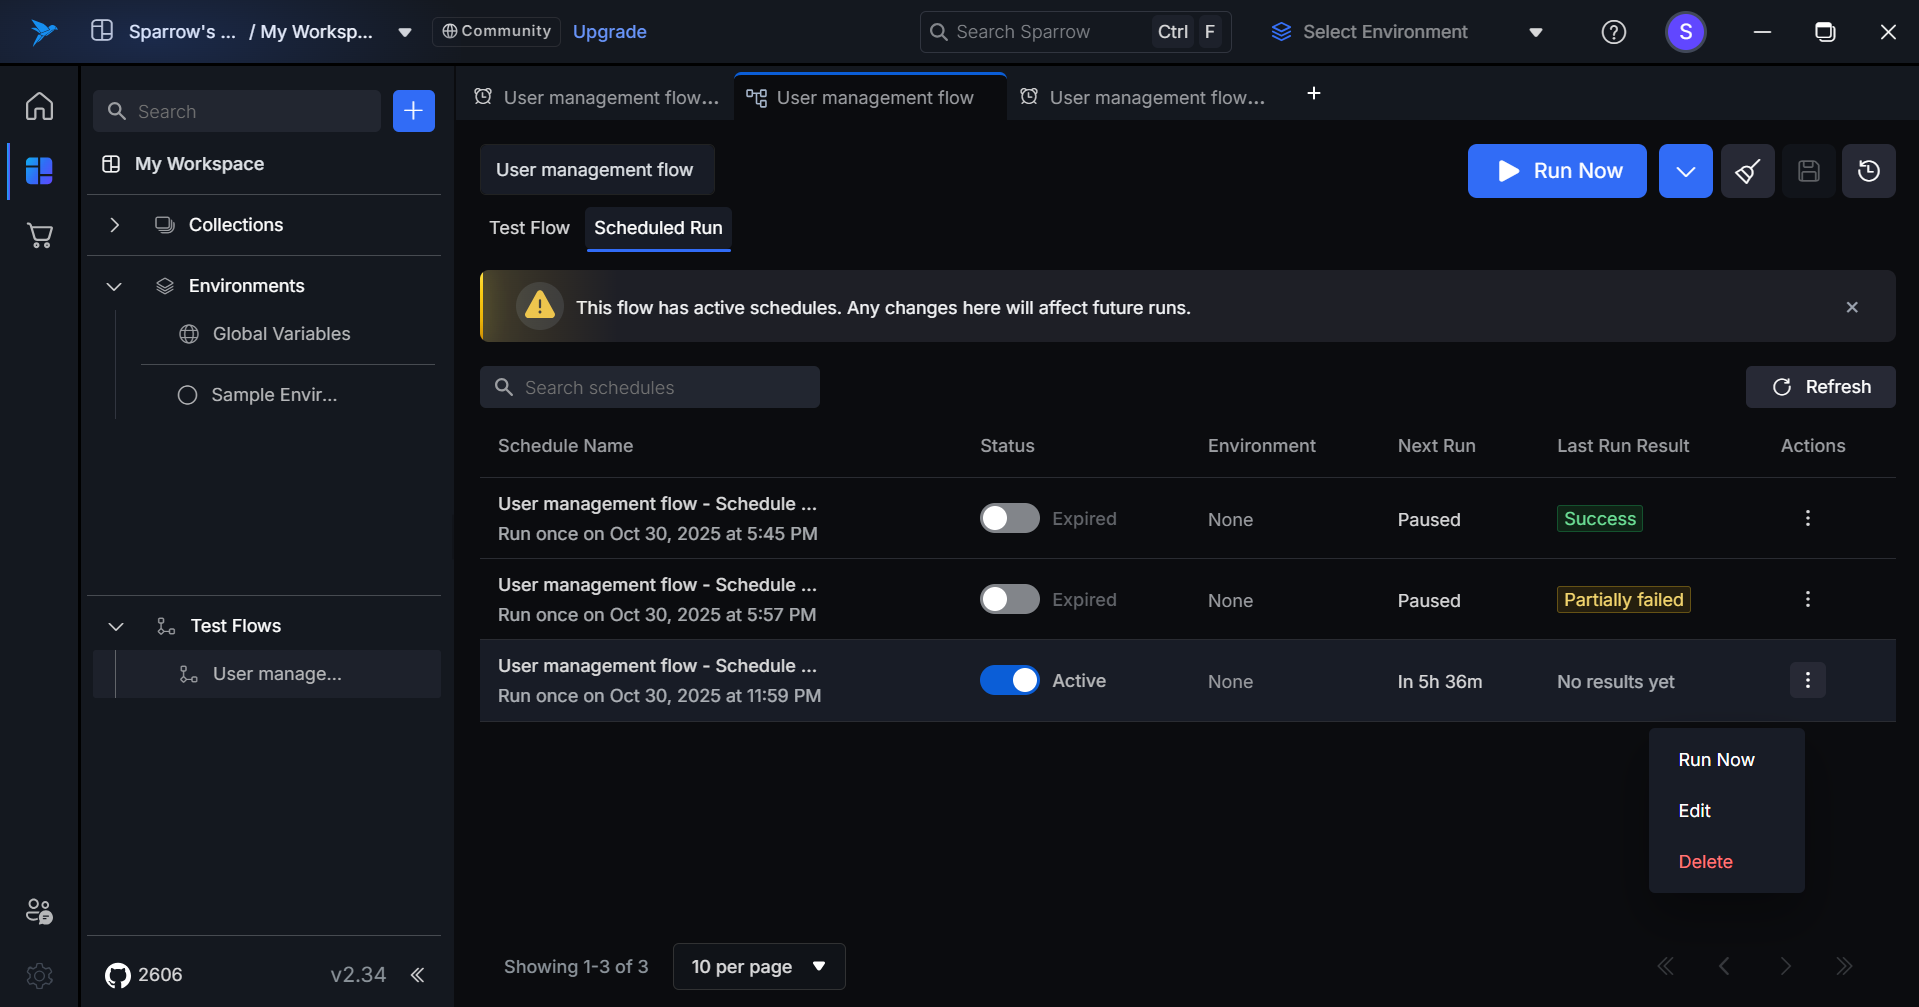
- Run Now: Executes the schedule immediately, bypassing the configured timing.
- Edit: Opens the schedule configuration to modify settings such as timing, environment, or notifications.
- Delete: Permanently removes the schedule from the system.
Schedule Run
Real-Time Filtering: Search works in real-time as users type, matching schedules are instantly displayed. No Results State: If no match is found, showing a simple message "No results found".
Activate/Deactivate the Scheduled Runs
The toggle switch allows you to temporarily pause scheduled test executions without losing your configuration.
Steps to Activate/Deactivate
Step 1: Click on the Scheduled run of the Test flow you want to Activate/Deactivate.
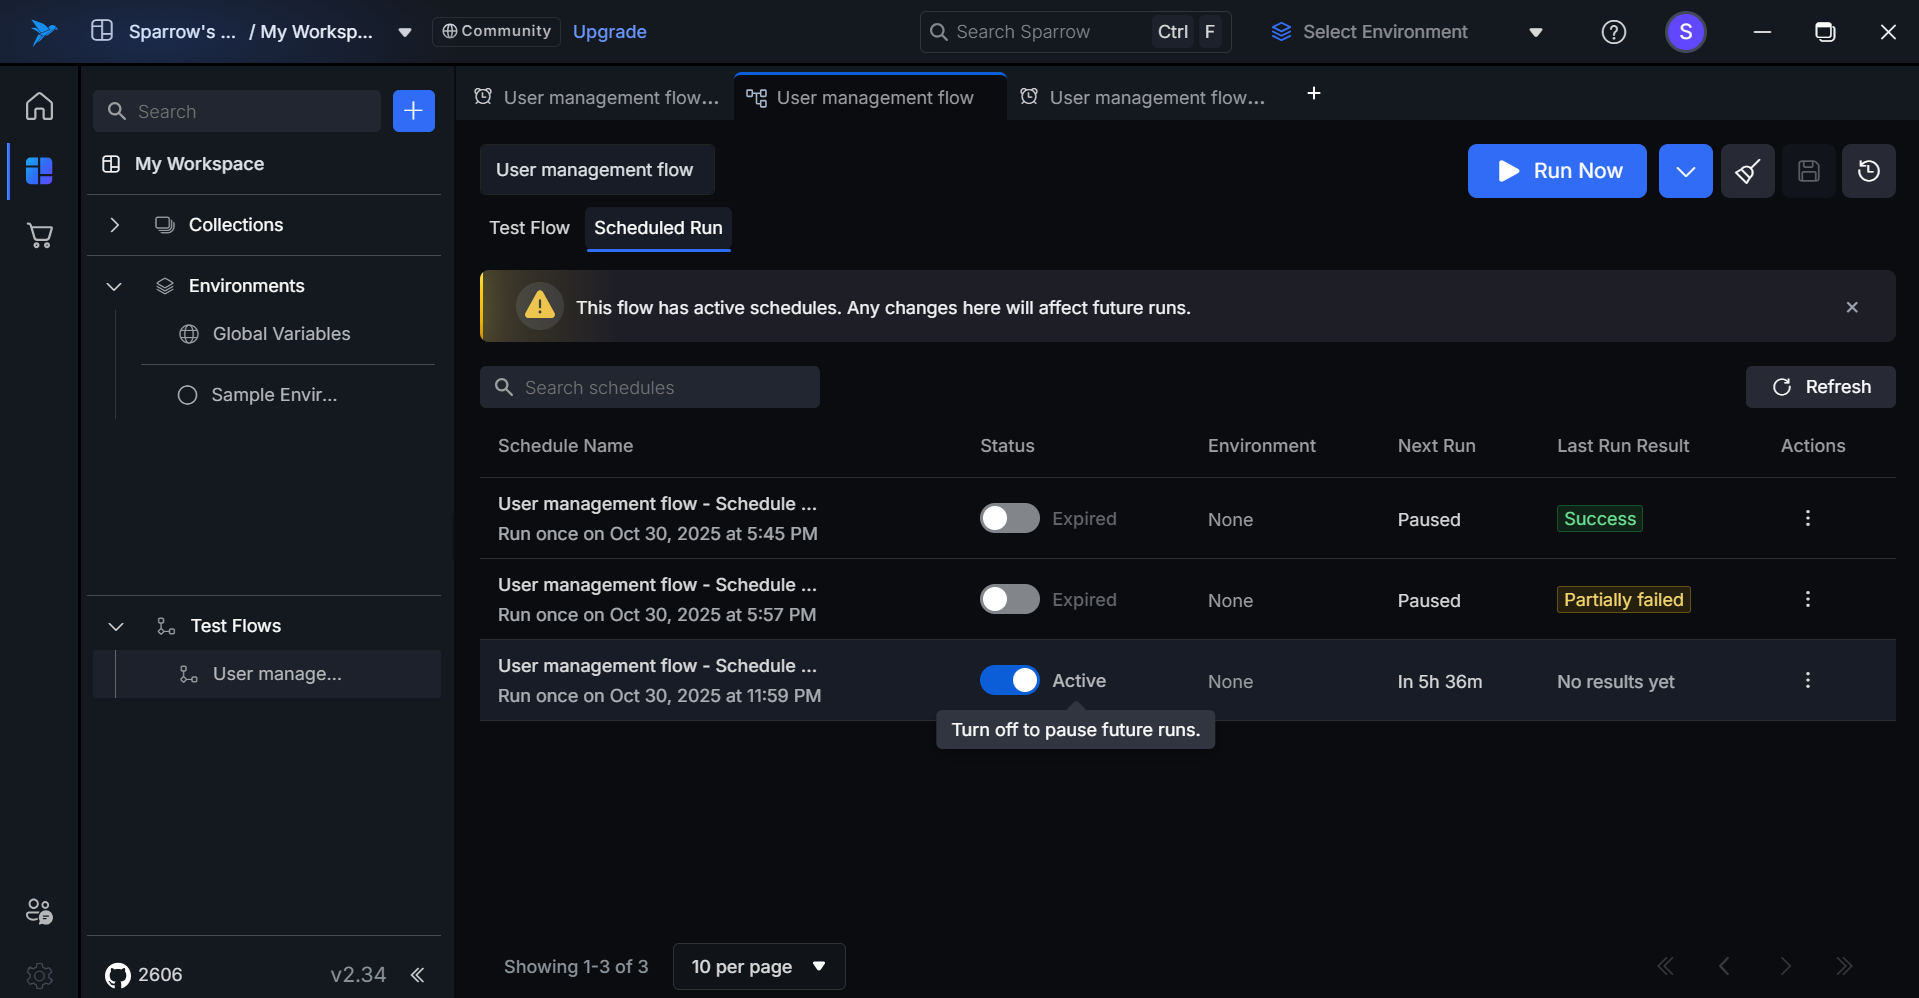
Step 2: To Activate the Scheduled run:
- Turn on the toggle switch to activate the Scheduled run. Now the Schedule run is Active.
Active Schedule
Toggle switch is ON.
Tooltip (on hover): "Turn off to pause future runs"
To Deactivate the Schedule run
- You can turn off the toggle switch to Deactivate the Scheduled run.
Inactive (Paused) Schedule
- Toggle switch: OFF
- Indicator: Row remains visible with "Paused" status displayed in subtle grey tone
- Tooltip (on hover): "Turn on to resume future runs"
Expired Schedule
- Toggle switch is disabled and greyed out (non-interactive).
- Status displays as "Completed".
- Tooltip (on hover): "This schedule has completed all its runs and cannot be reactivated"
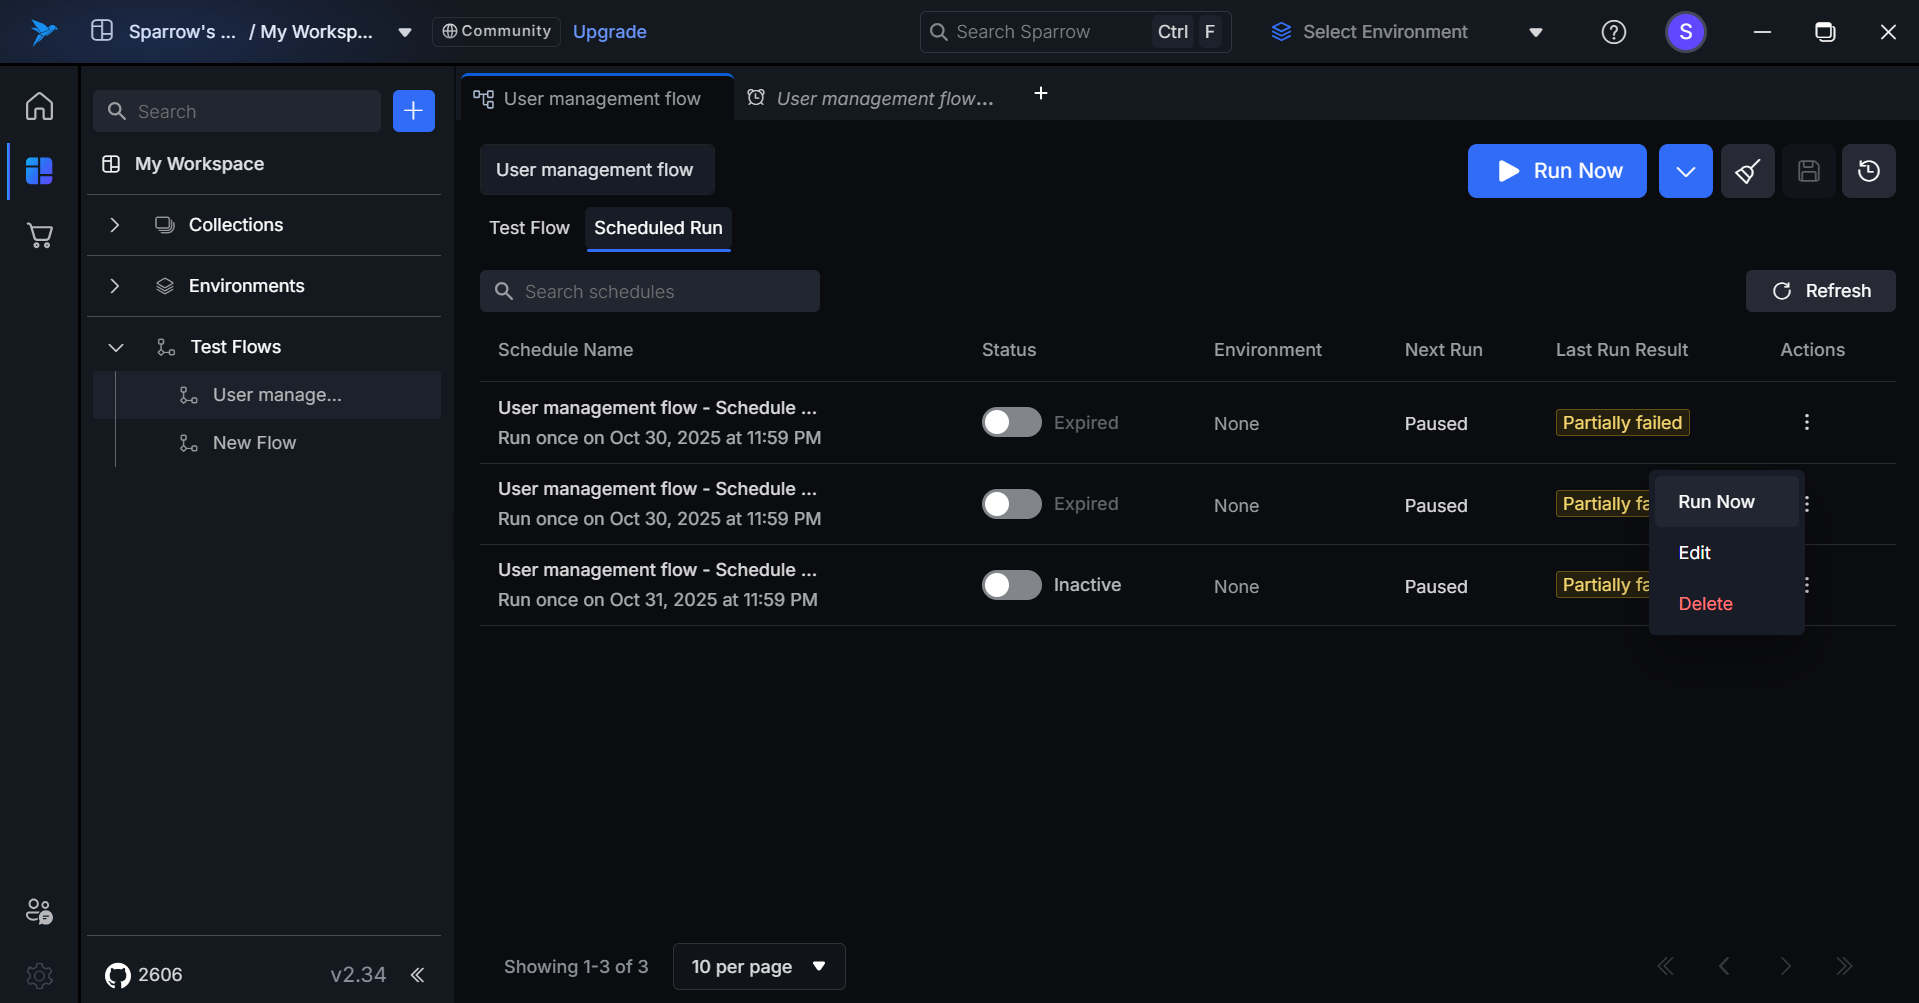
Actions on the Scheduled runs
Run Now
Clicking Run Now triggers an immediate execution of the schedule. This action does not affect future scheduled runs.
Steps to Run now (For Active/Inactive/Expired Schedules):
- Hover over and click the Action option on the desired Schedule.
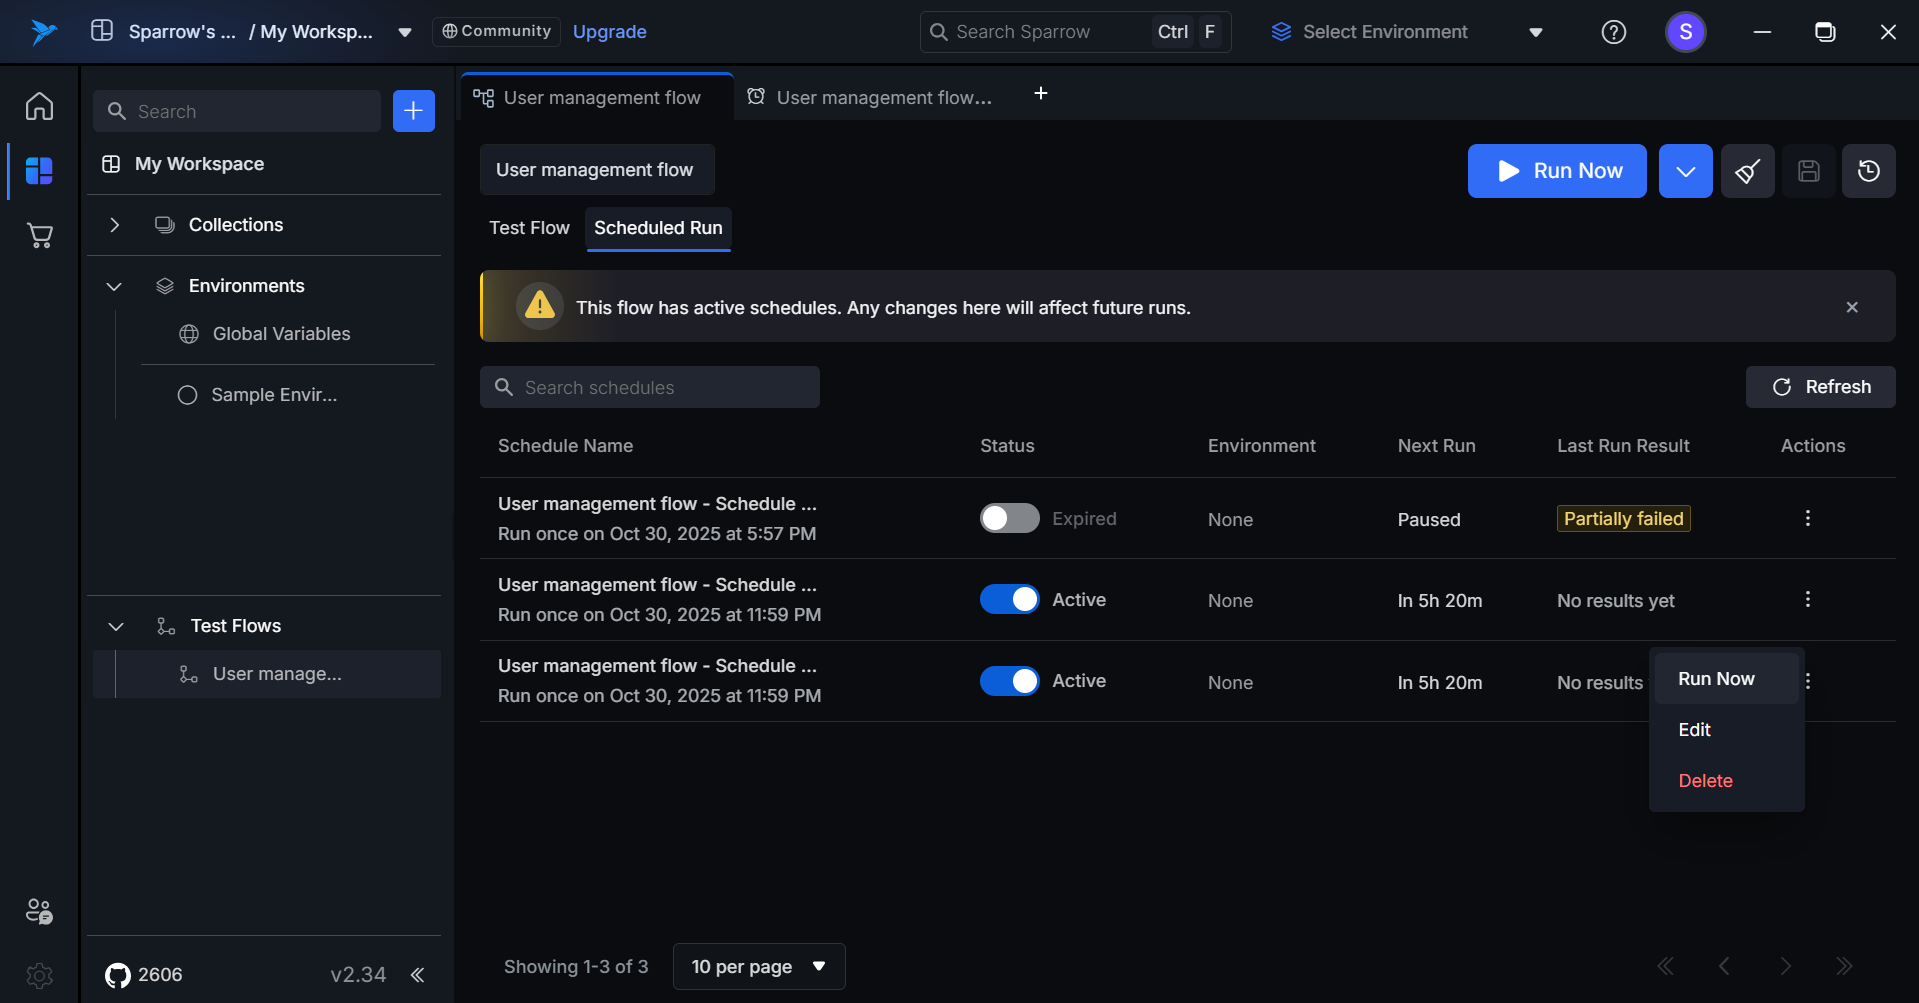
-
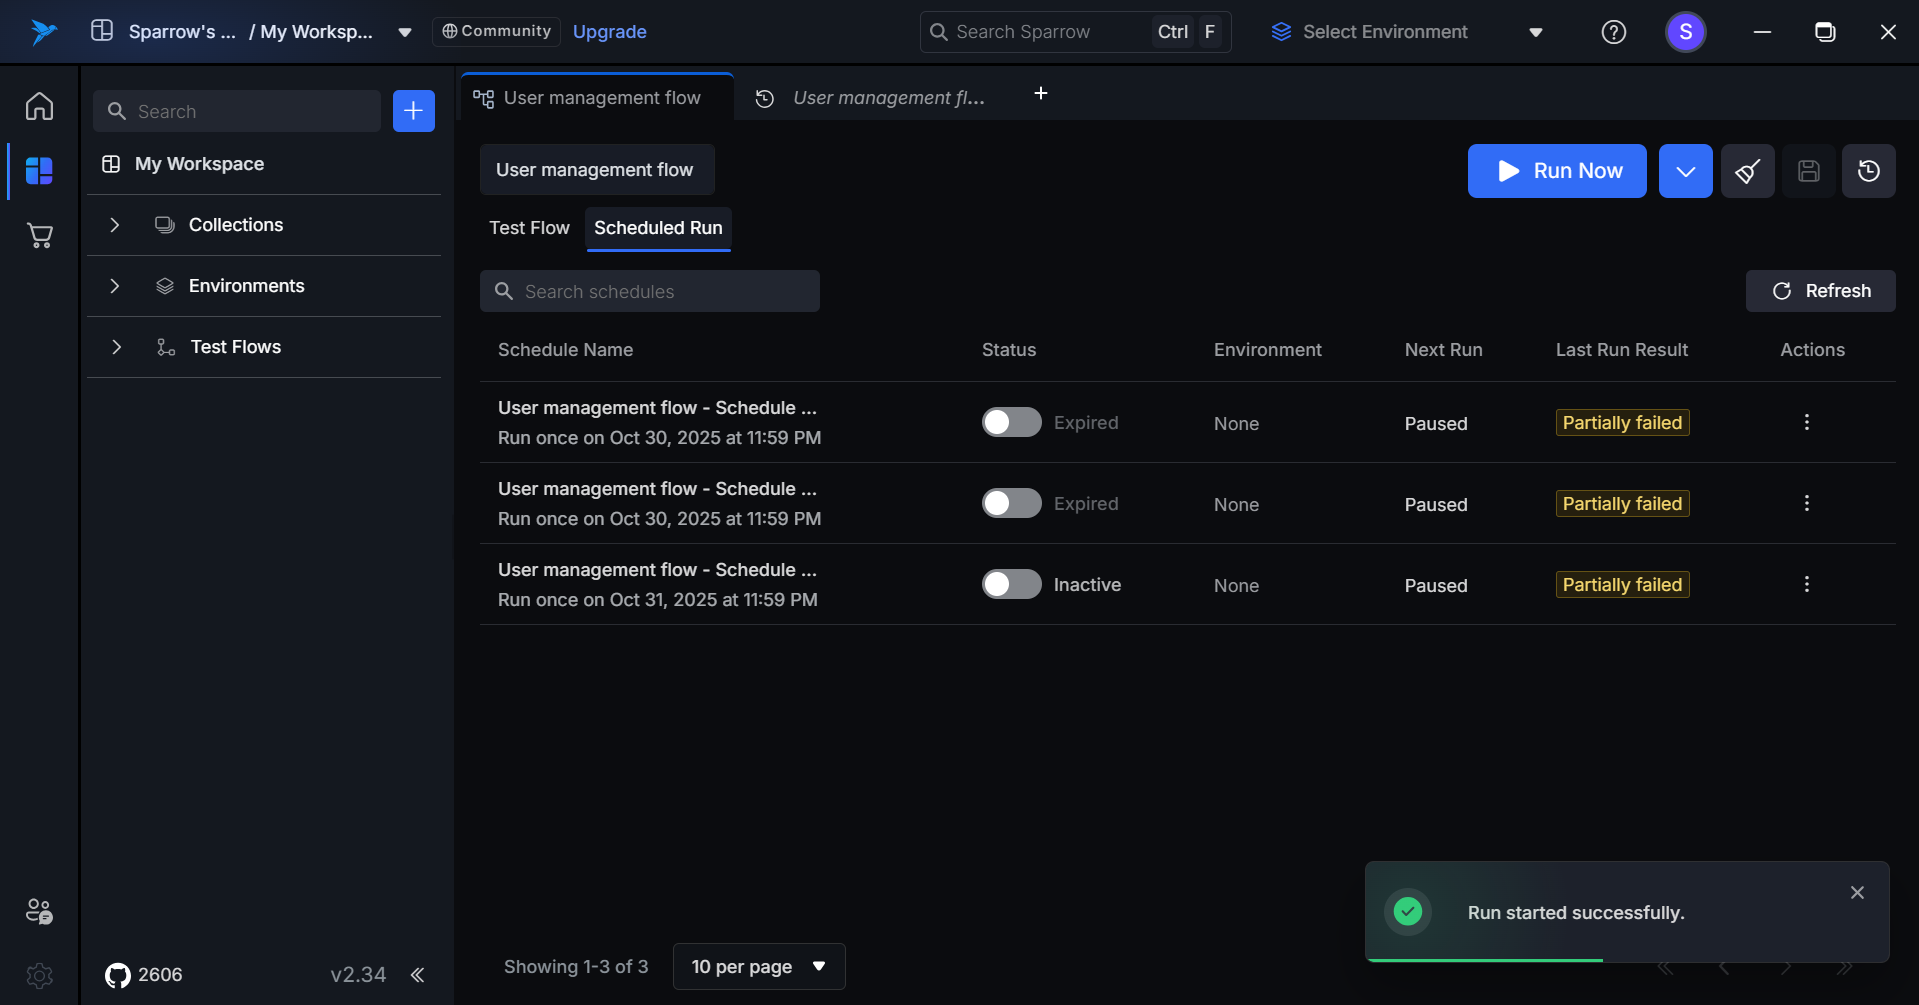
Click on Run now option to run the Schedule of the desired test flow. When Run Now is triggered, the Last Run Result field is replaced with a loading spinner to indicate the test execution is currently in progress. “Run started successfully” notification appears at bottom of the tab.
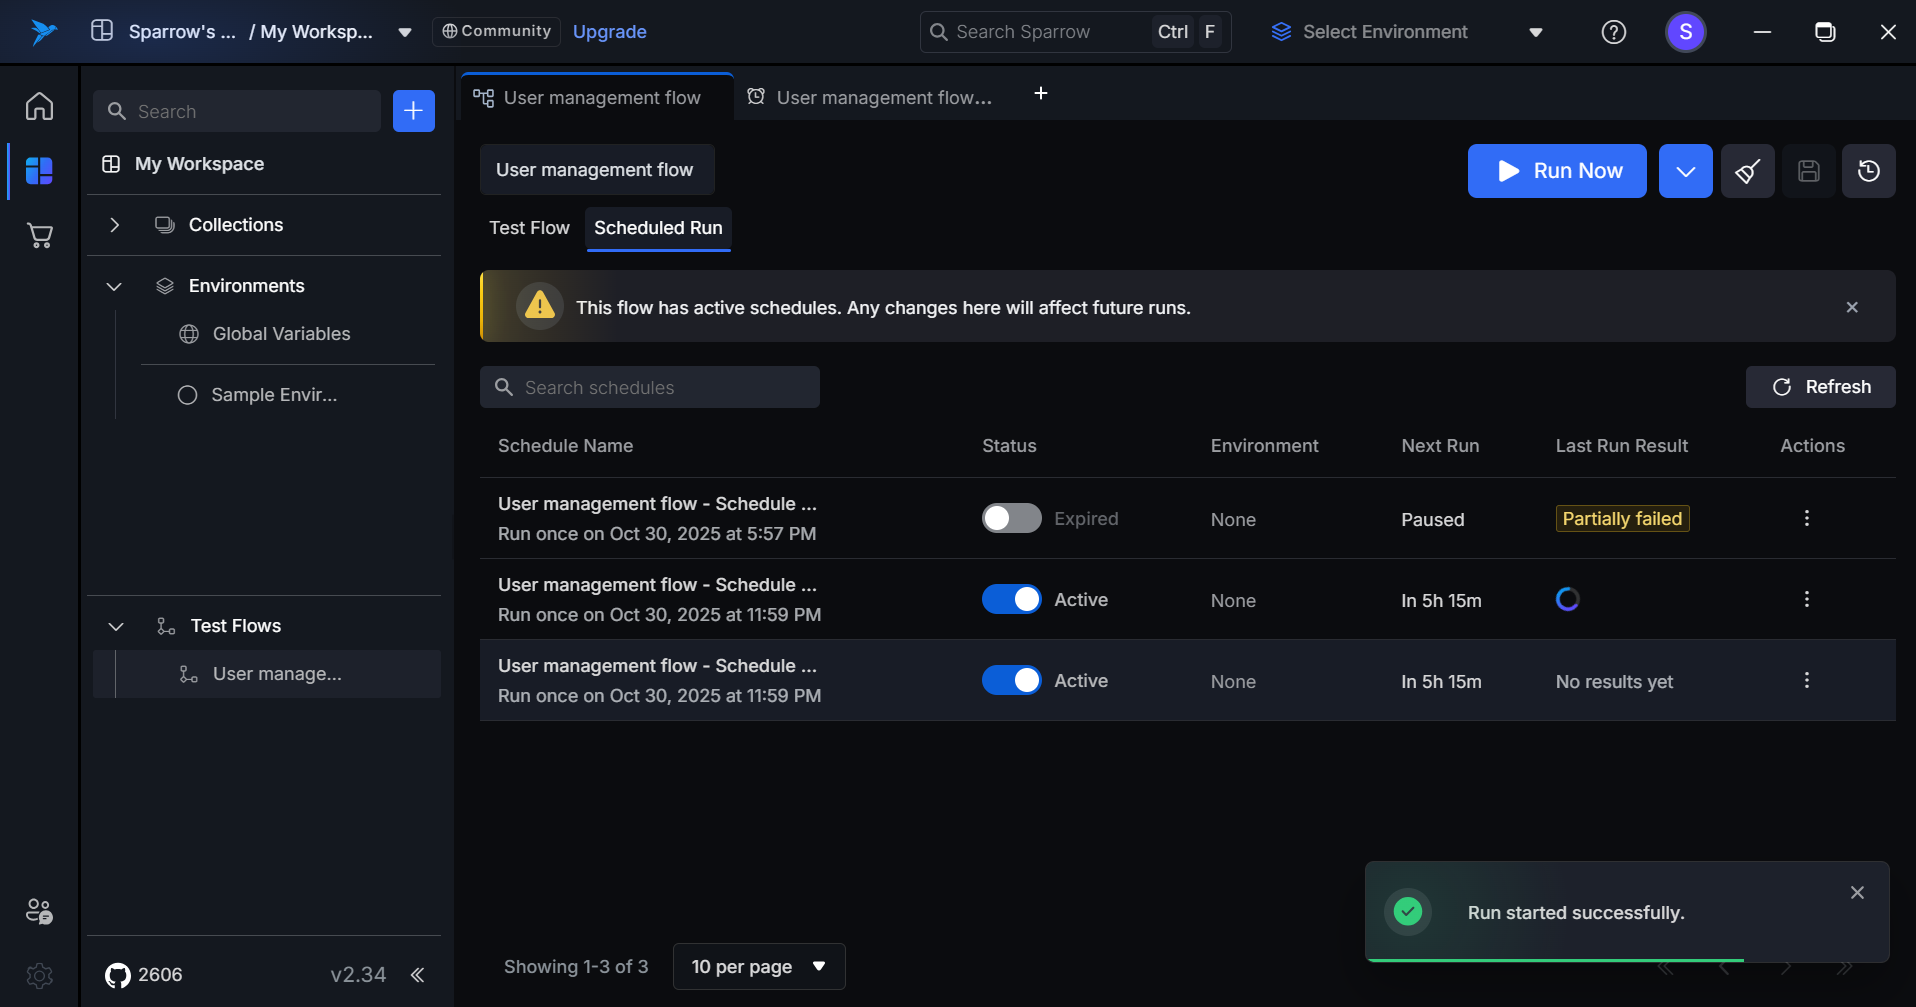
After execution completes, the Last Run Result field updates automatically to display the outcome with the appropriate status tag (Passed, Failed, Partially Failed, or Error).
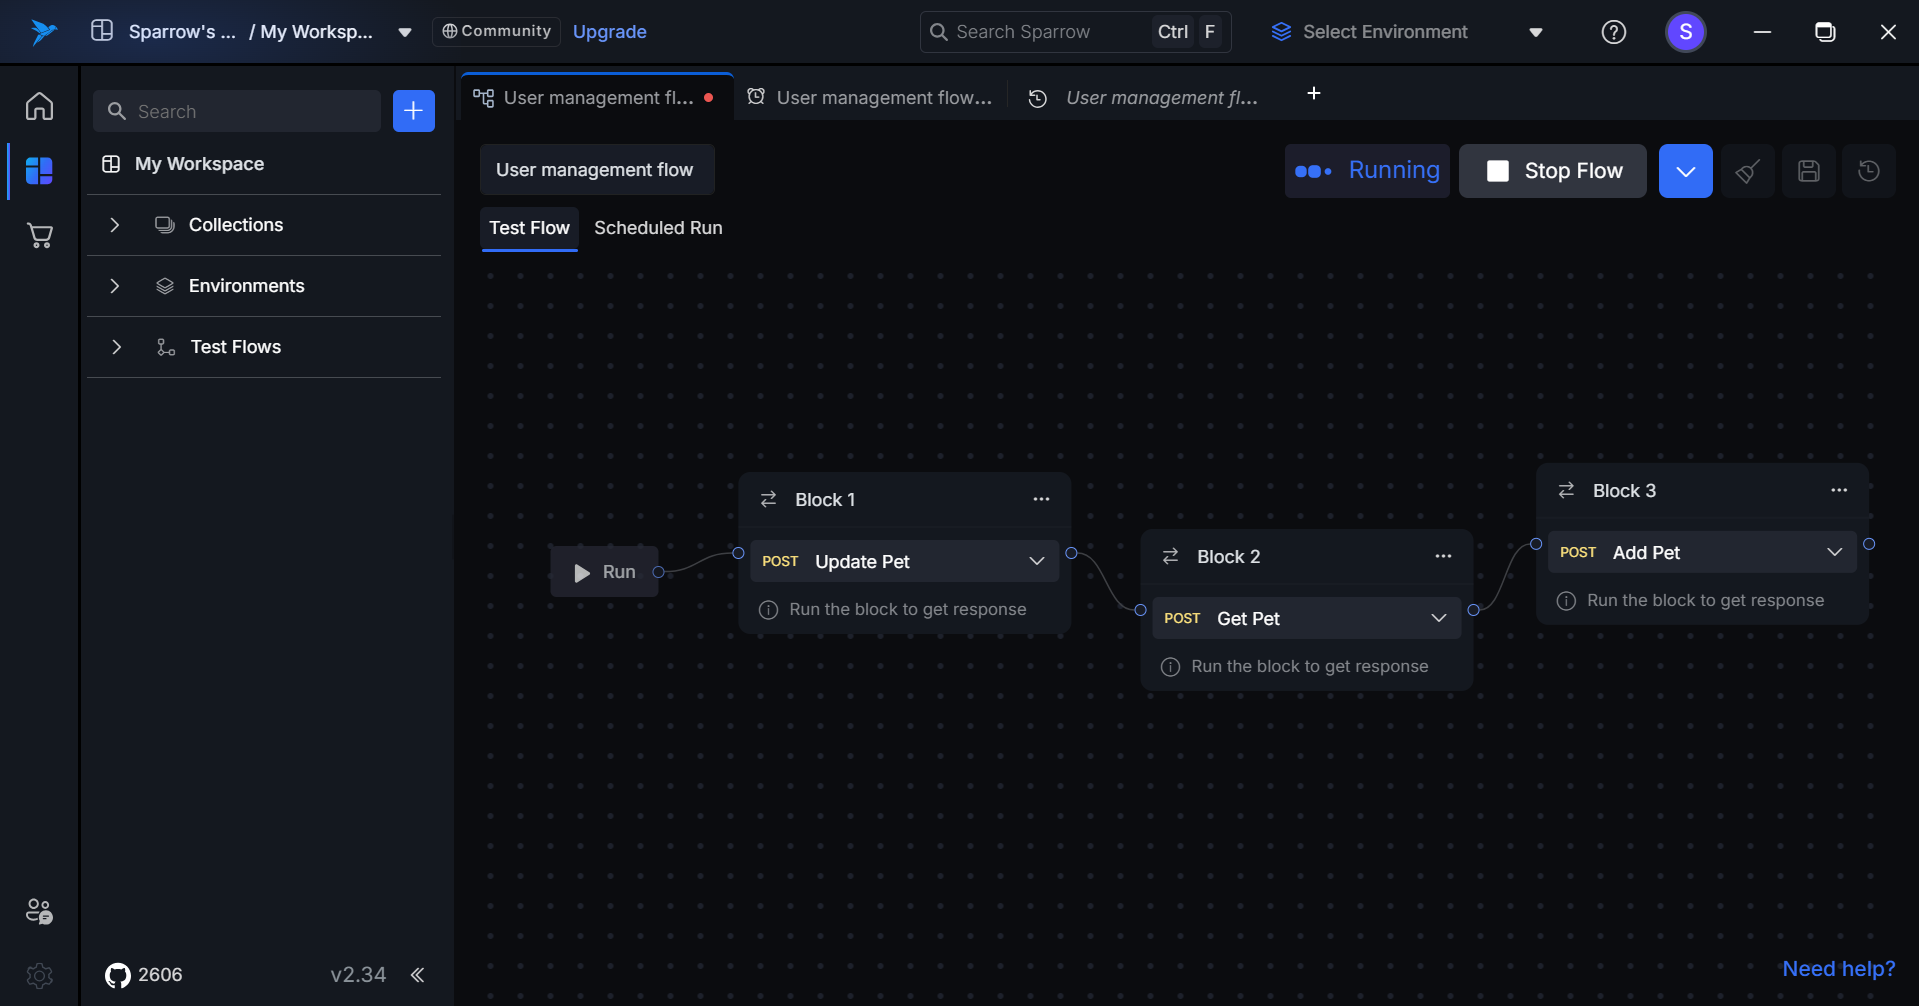
- Clicking Run Now redirects users to the Test Flow tab and immediately executes the selected flow with standard execution behavior.
For Inactive Schedules
Step 1: Hover over and click the Action option on the desired Schedule of the Test flow you wanted to run.
Step 2:
Click on Run Now option to run the Schedule of the desired test flow.
When Run Now is triggered, the Last Run Result field is replaced with a loading spinner to indicate the test execution is currently in progress.
A “Run started successfully” notification appears at the bottom of the tab.
Step 3: The Run has now started successfully.
Running an Expired Schedule
Step 1: Hover over and click the Action option on the desired Schedule of the Test flow you wanted to run. Step 2: You can click on Run Now option from the menu to run the Schedule. You can see the history by clicking on the Scheduled run
Edit Schedule
Clicking Edit on a schedule redirects users to the Edit Schedule page, with all existing configuration settings pre-filled.
Steps to Edit a Schedule:
Step 1: Hover over to the Actions menu in the desired Scheduled run and click on it. An Action menu appears with Run Now, Edit, and Delete options.
**
Step 2: Click on the Edit option in the menu. When the user clicks Edit on a schedule, they are navigated to the Edit Schedule page with all existing configuration details pre-filled.
Step 3: You can edit the details of the Configuration of the selected schedule like Name, Environment, Run Configuration, Email recipients etc.
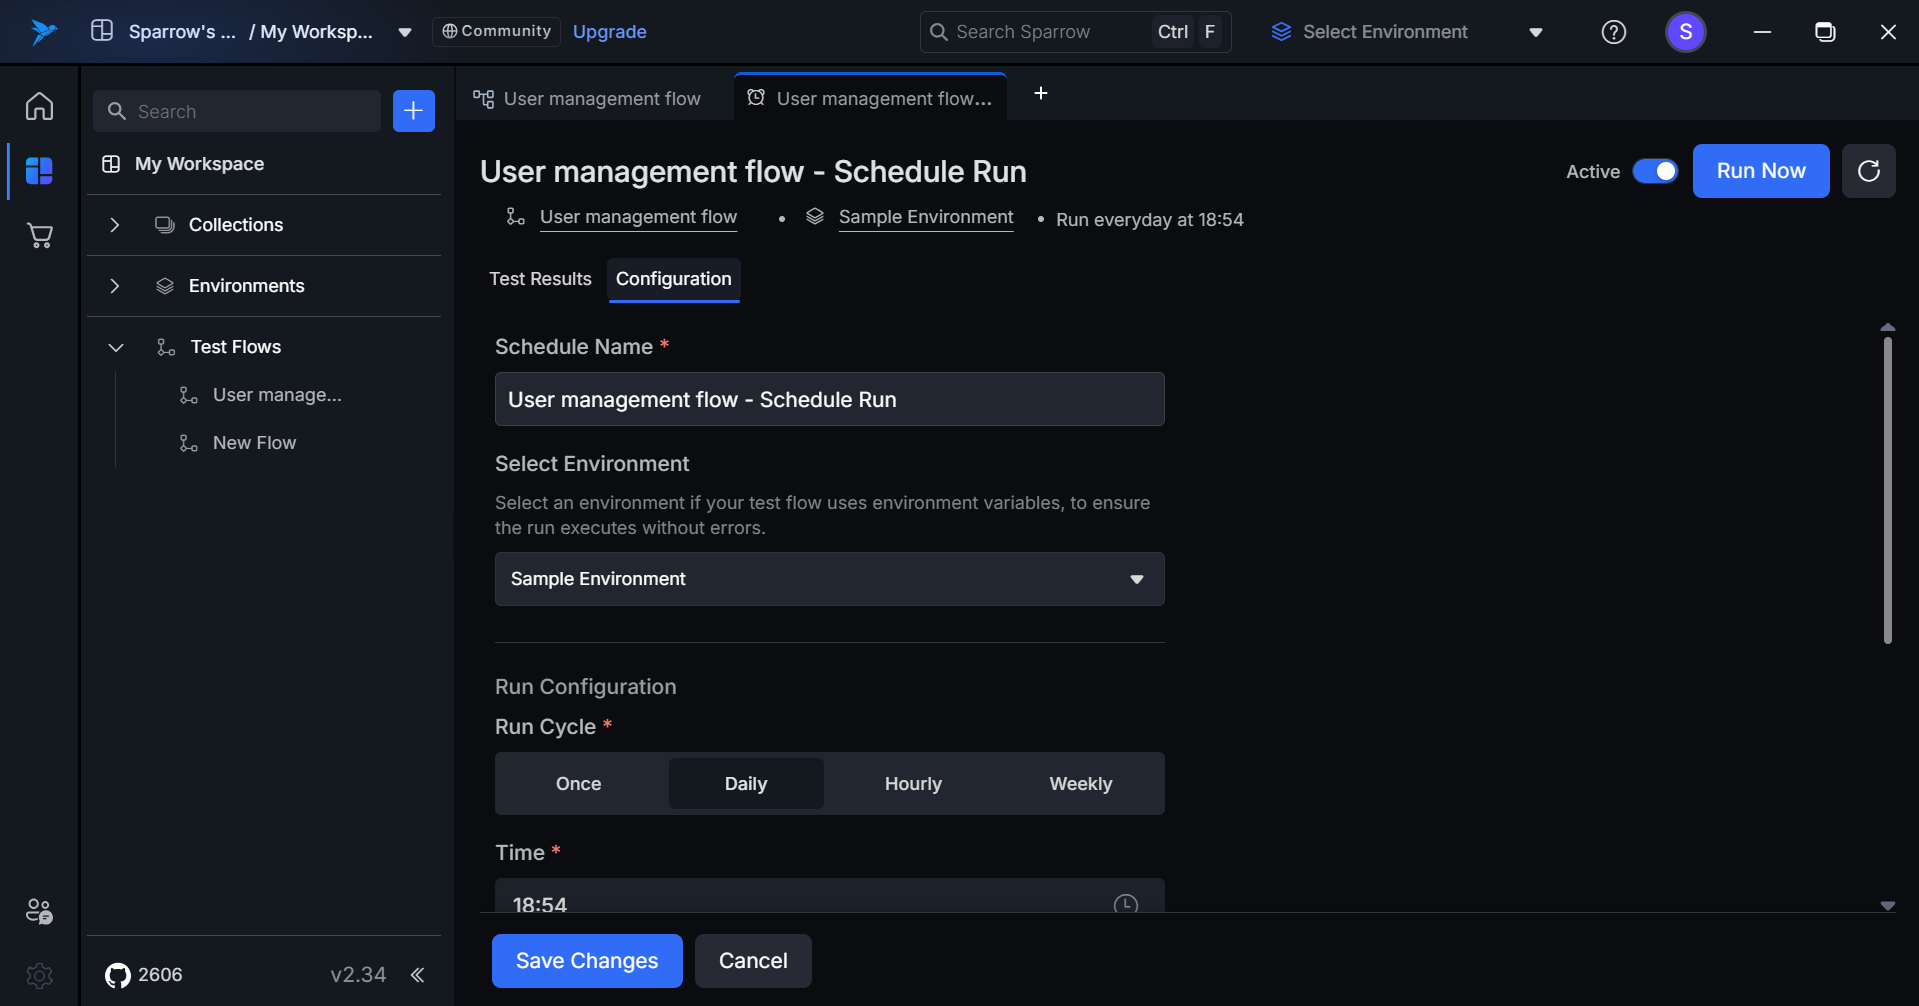
Step 4: You can click on Save Changes button present at the bottom of the tab to save all the made changes to the configuration.
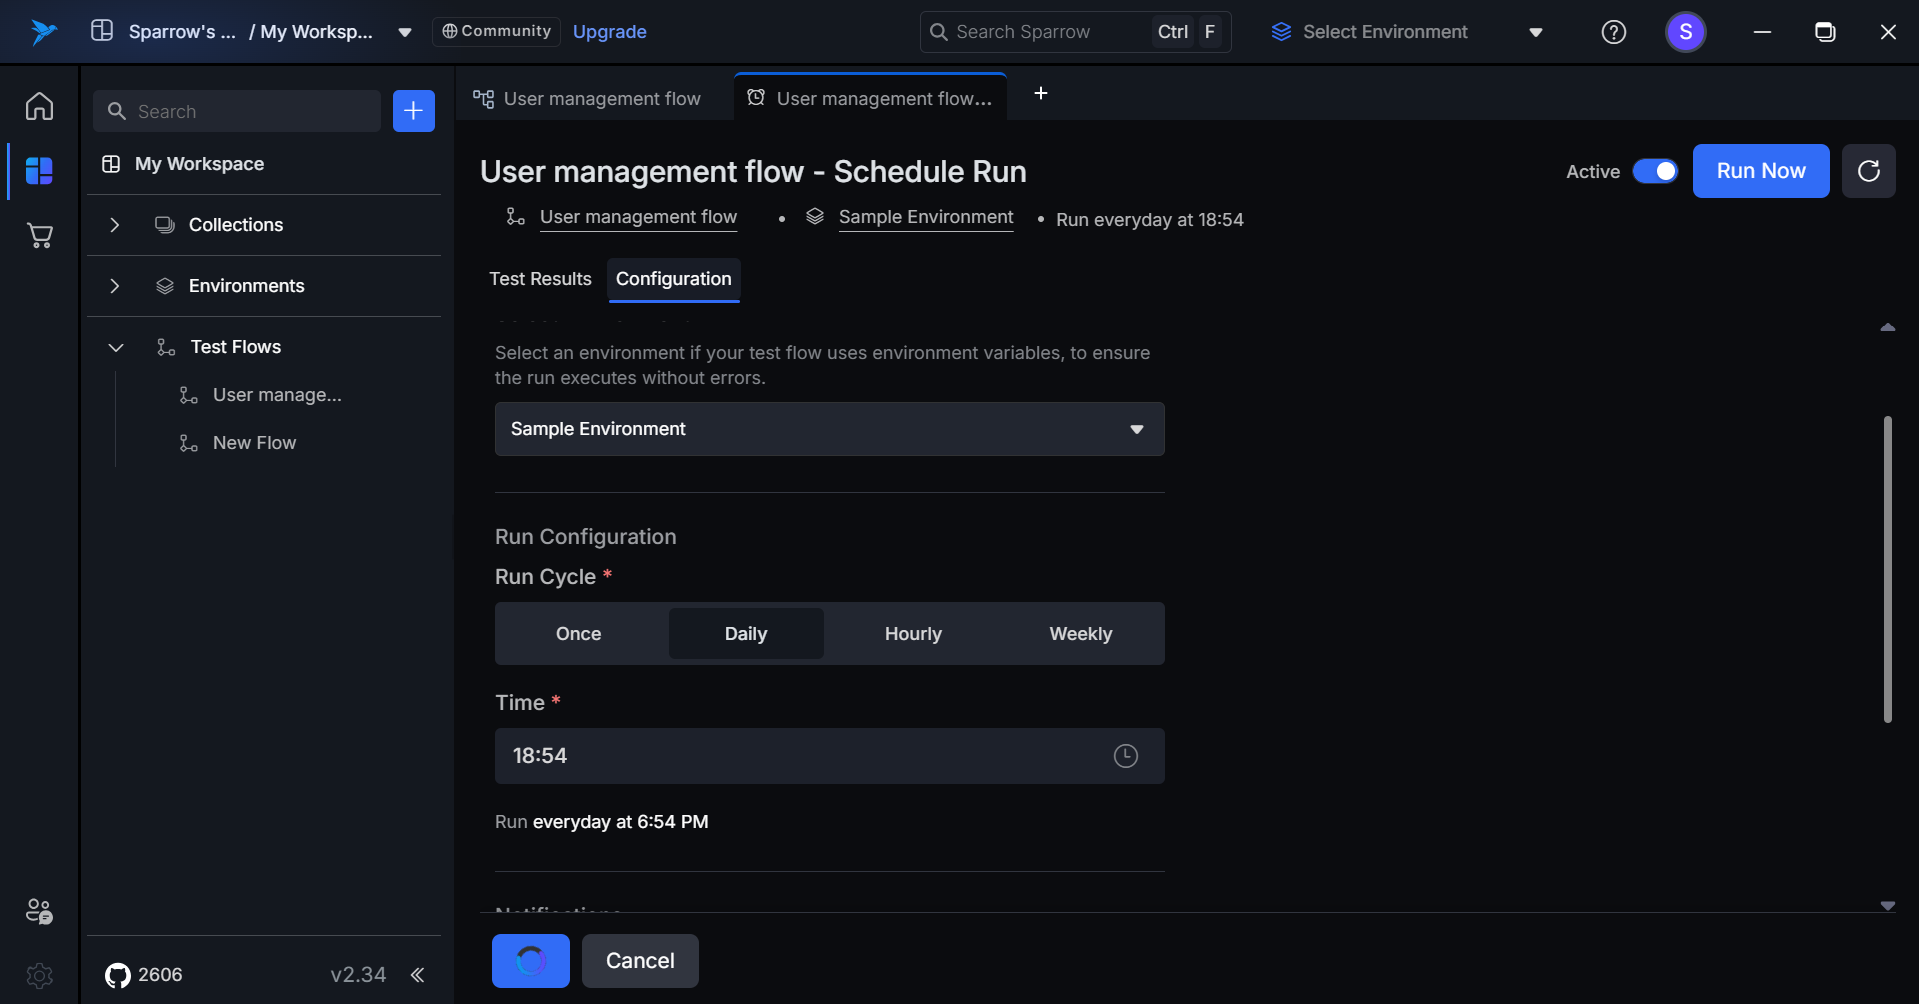
Step 5: A notification appears confirming the schedule got saved successfully.
- Failure: “Failed to save schedule. Please try again” toast message appears.If you encounter an error when saving your schedule, carefully review all configuration steps to ensure complete and accurate information, then resubmit to successfully save the schedule.
Delete Schedule
The Delete action permanently removes a schedule and all its associated configuration settings from the system. A confirmation dialog appears before deletion.
Steps to Delete a Schedule:
Step 1: Hover over to the Actions menu in the desired Scheduled run and click on it. An Action menu appears with Run Now, Edit, and Delete options.
Step 2: Click on the Delete option. A pop up appears with the message: "Are you sure you want to delete '[Schedule Name]' scheduled run? This will remove all future runs and delete all associated results permanently. This action cannot be undone."
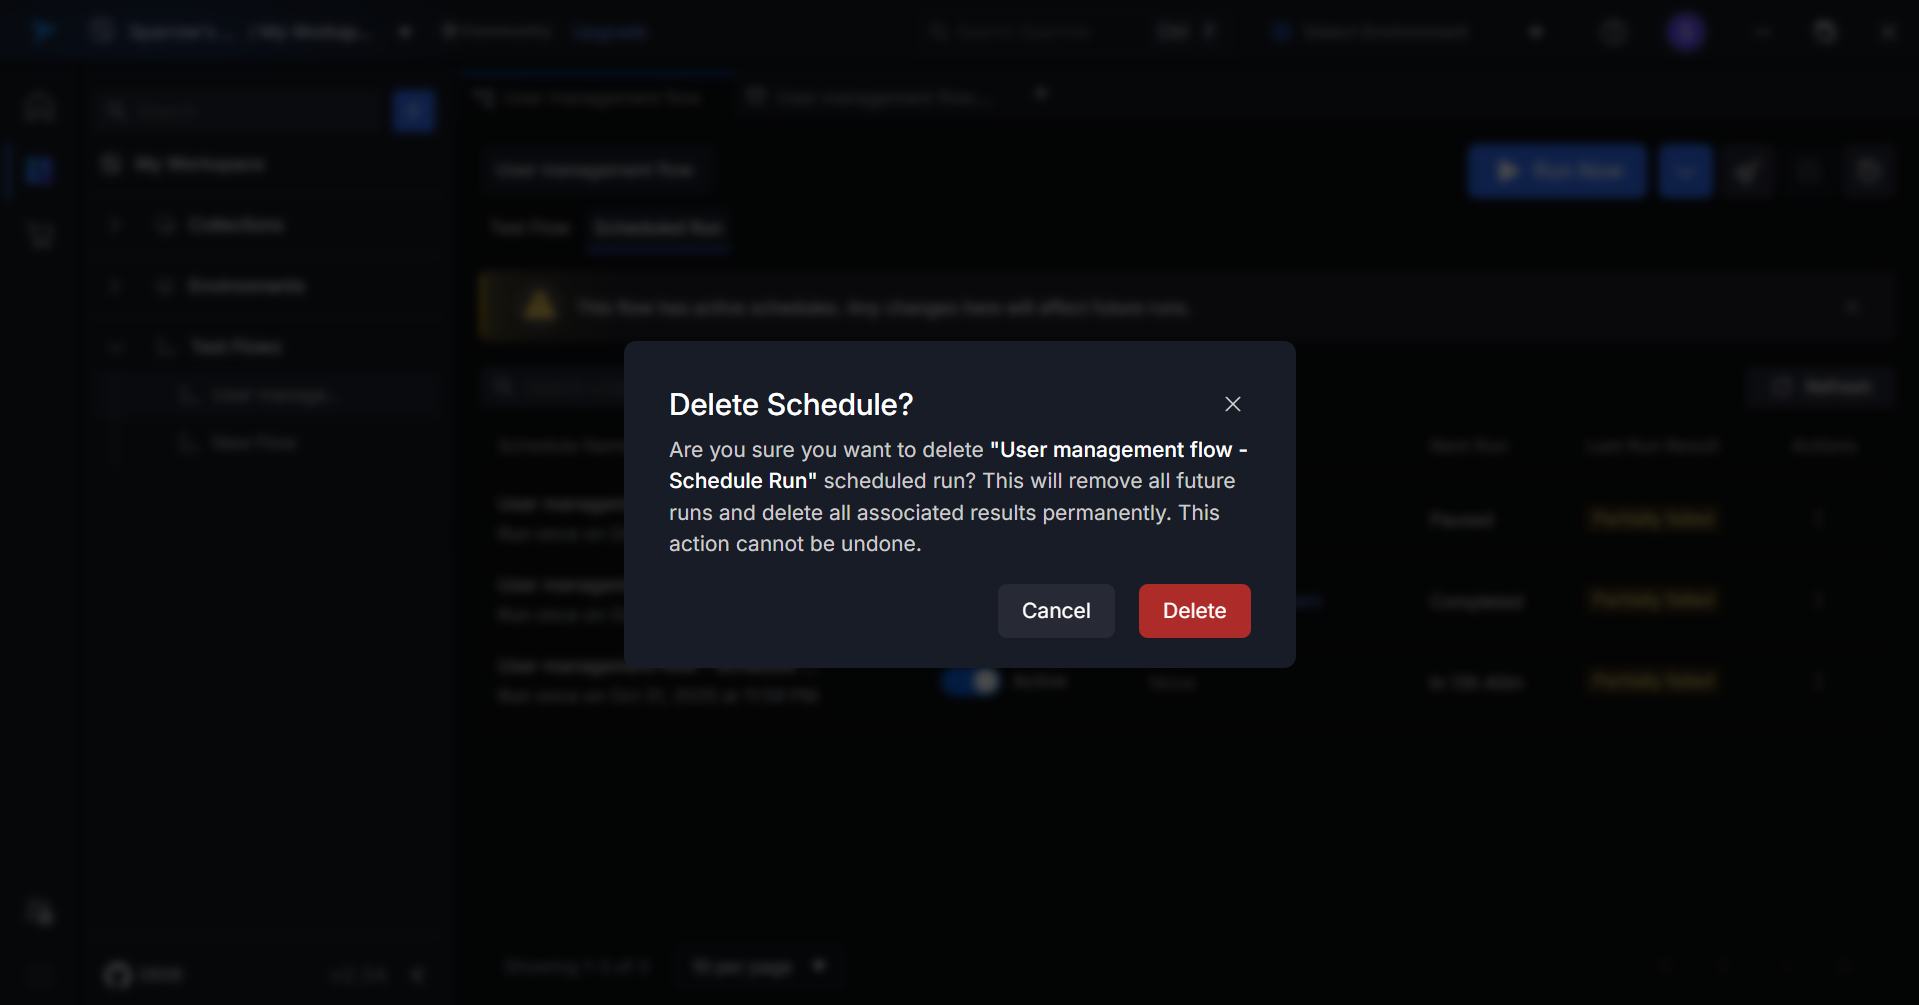
- Click on Delete option to delete the Schedule or Cancel to close the pop up. Upon clicking Delete in the confirmation dialog, the schedule is immediately and permanently removed from the system. The user is redirected back to the schedules list, where the deleted schedule no longer appears. A success notification may briefly display confirming the deletion was completed.
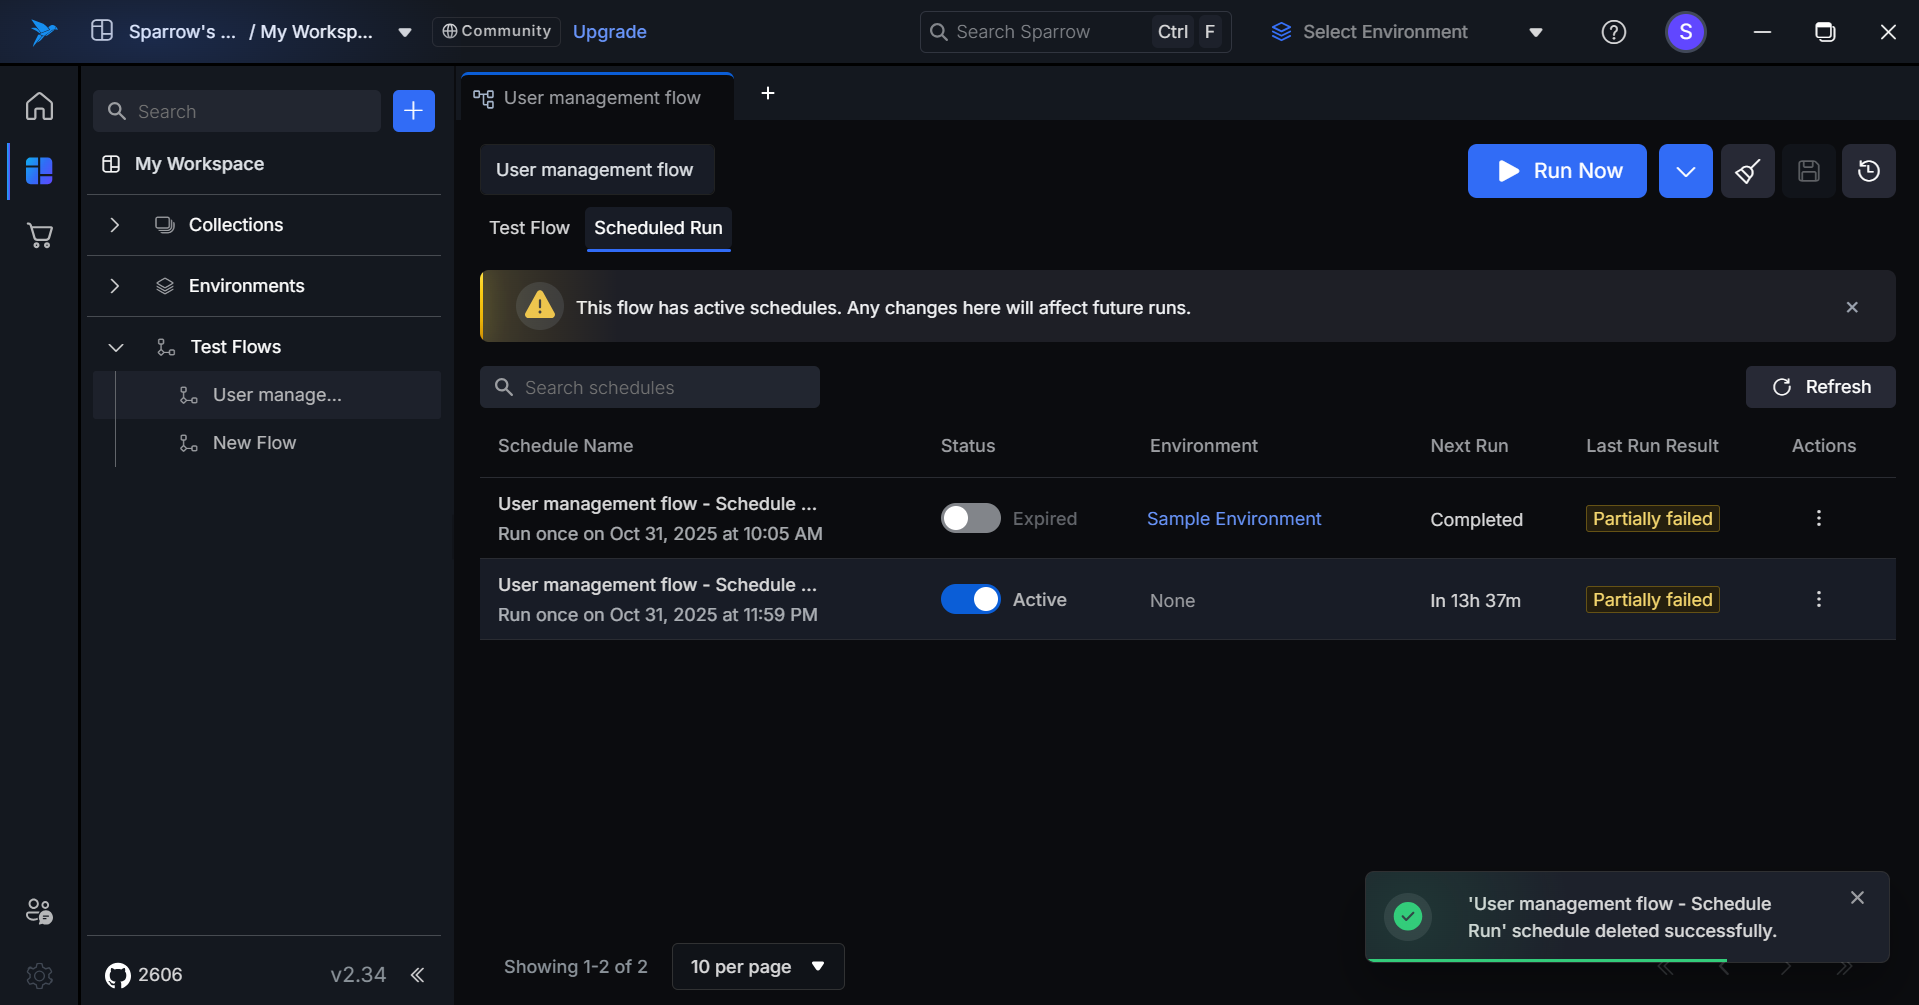
In case of Failure to delete the schedule. Try again the process for successful deletion.
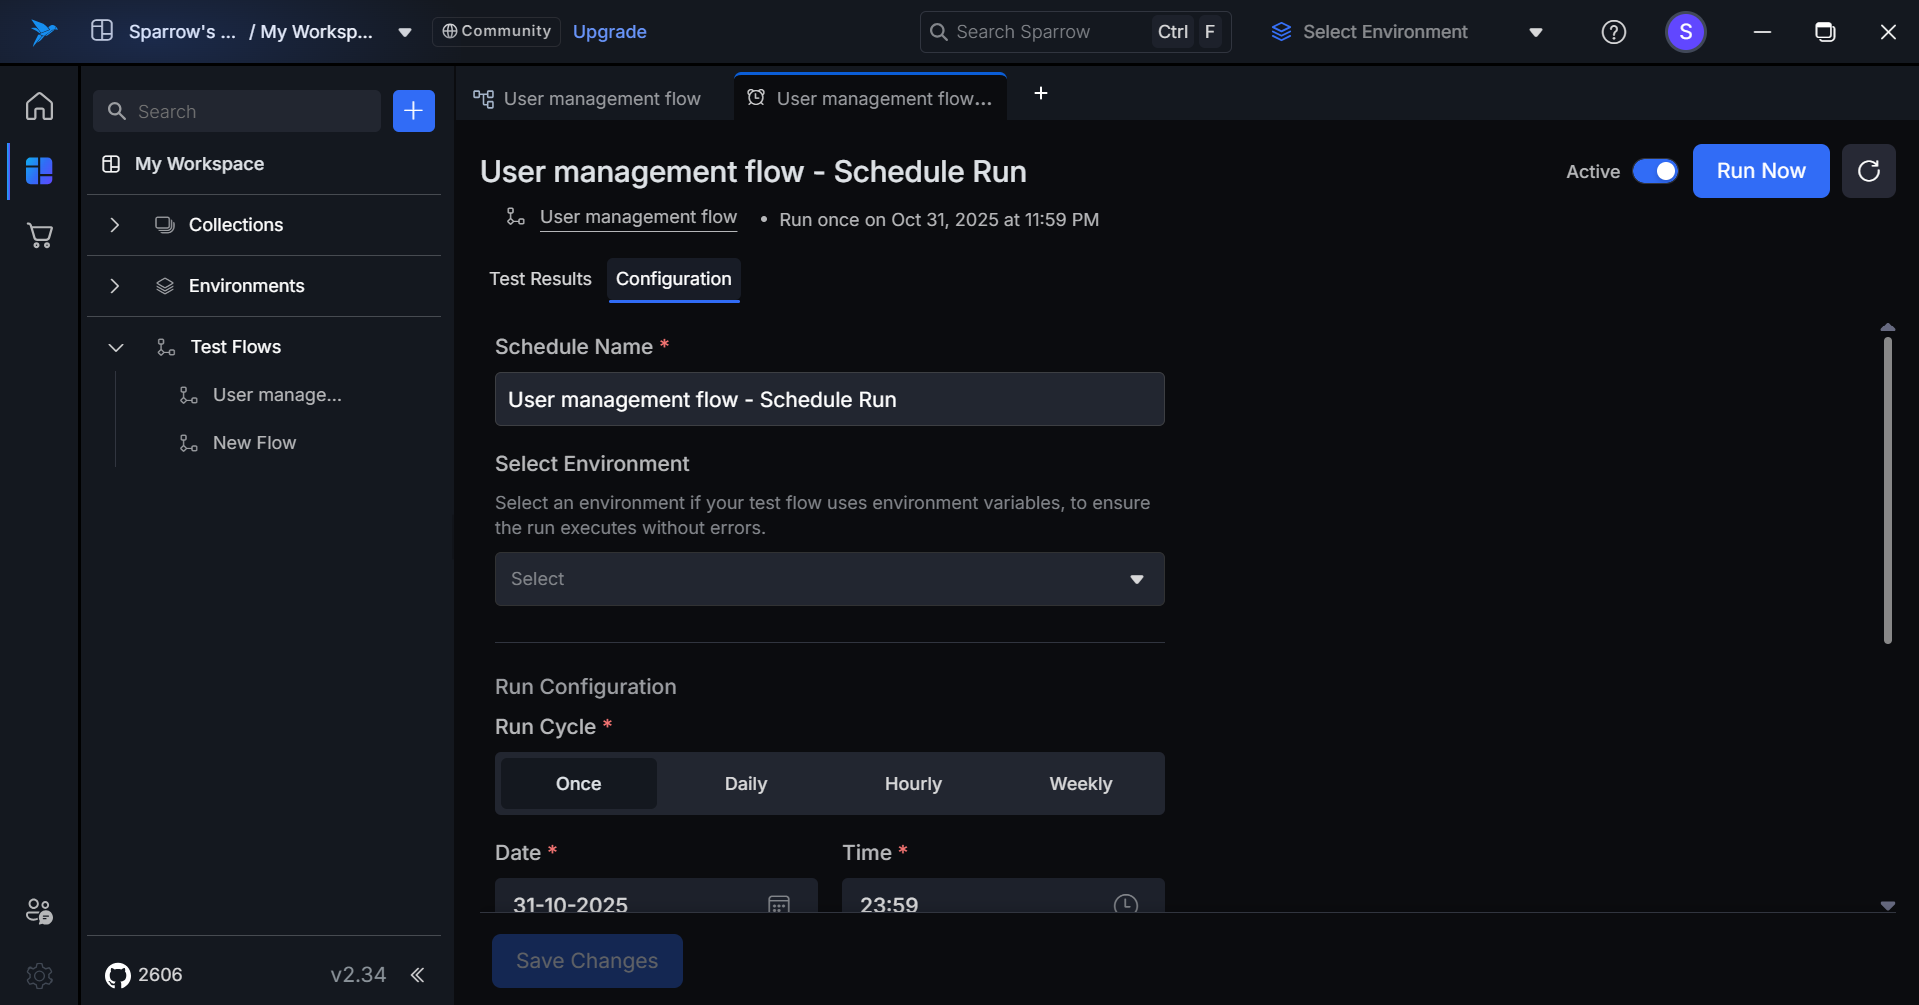
Single Schedule page
The Single Schedule Page displays comprehensive details and management options for an individual scheduled test flow. This dedicated page provides complete visibility into the schedule's configuration, execution history, and performance metrics.
- Clicking on the test flow name (e.g., "User management flow") opens the test flow in a new tab.
- After selecting a particular schedule from the Scheduled run list, you can view the Test results and Configuration of that specific Schedule.
Components
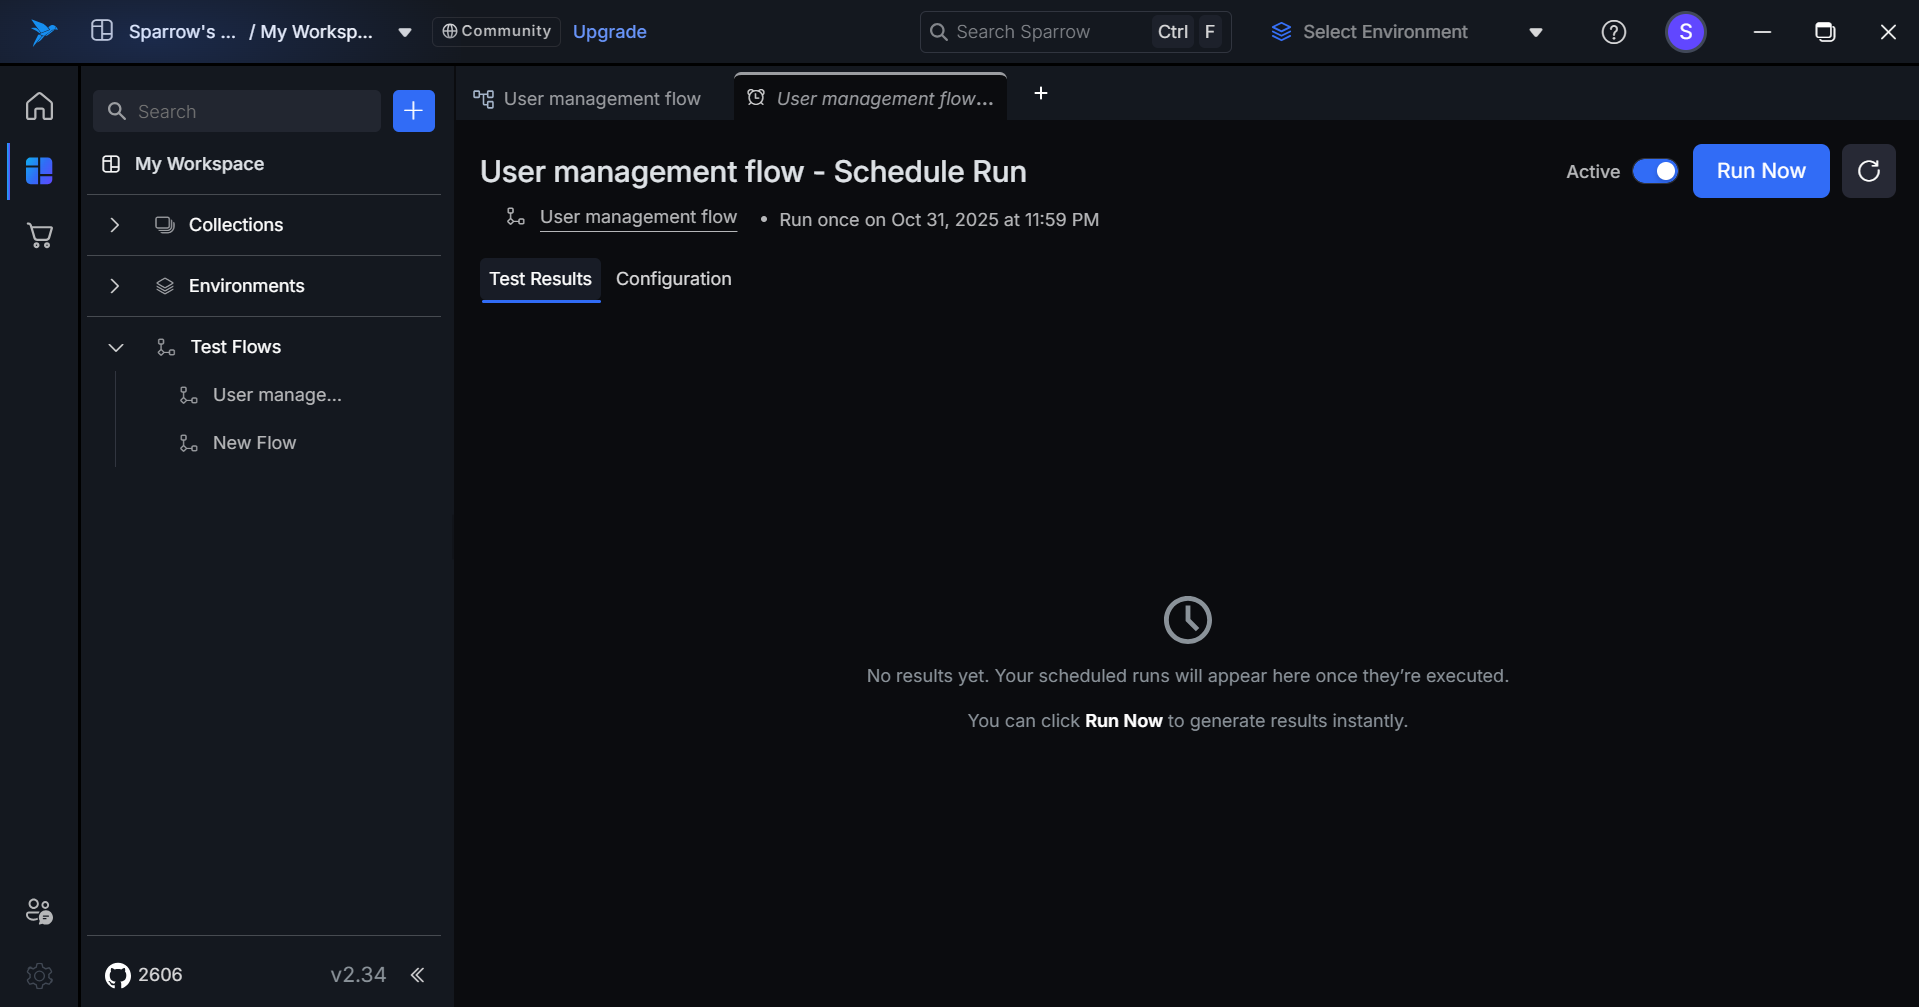
Test result - Empty
The empty state appears when a schedule has been created but hasn't executed any test runs yet.
- It displays a clock icon with a message informing users that results will automatically populate after the first scheduled execution.
- Users can optionally click Run Now to trigger an immediate execution.
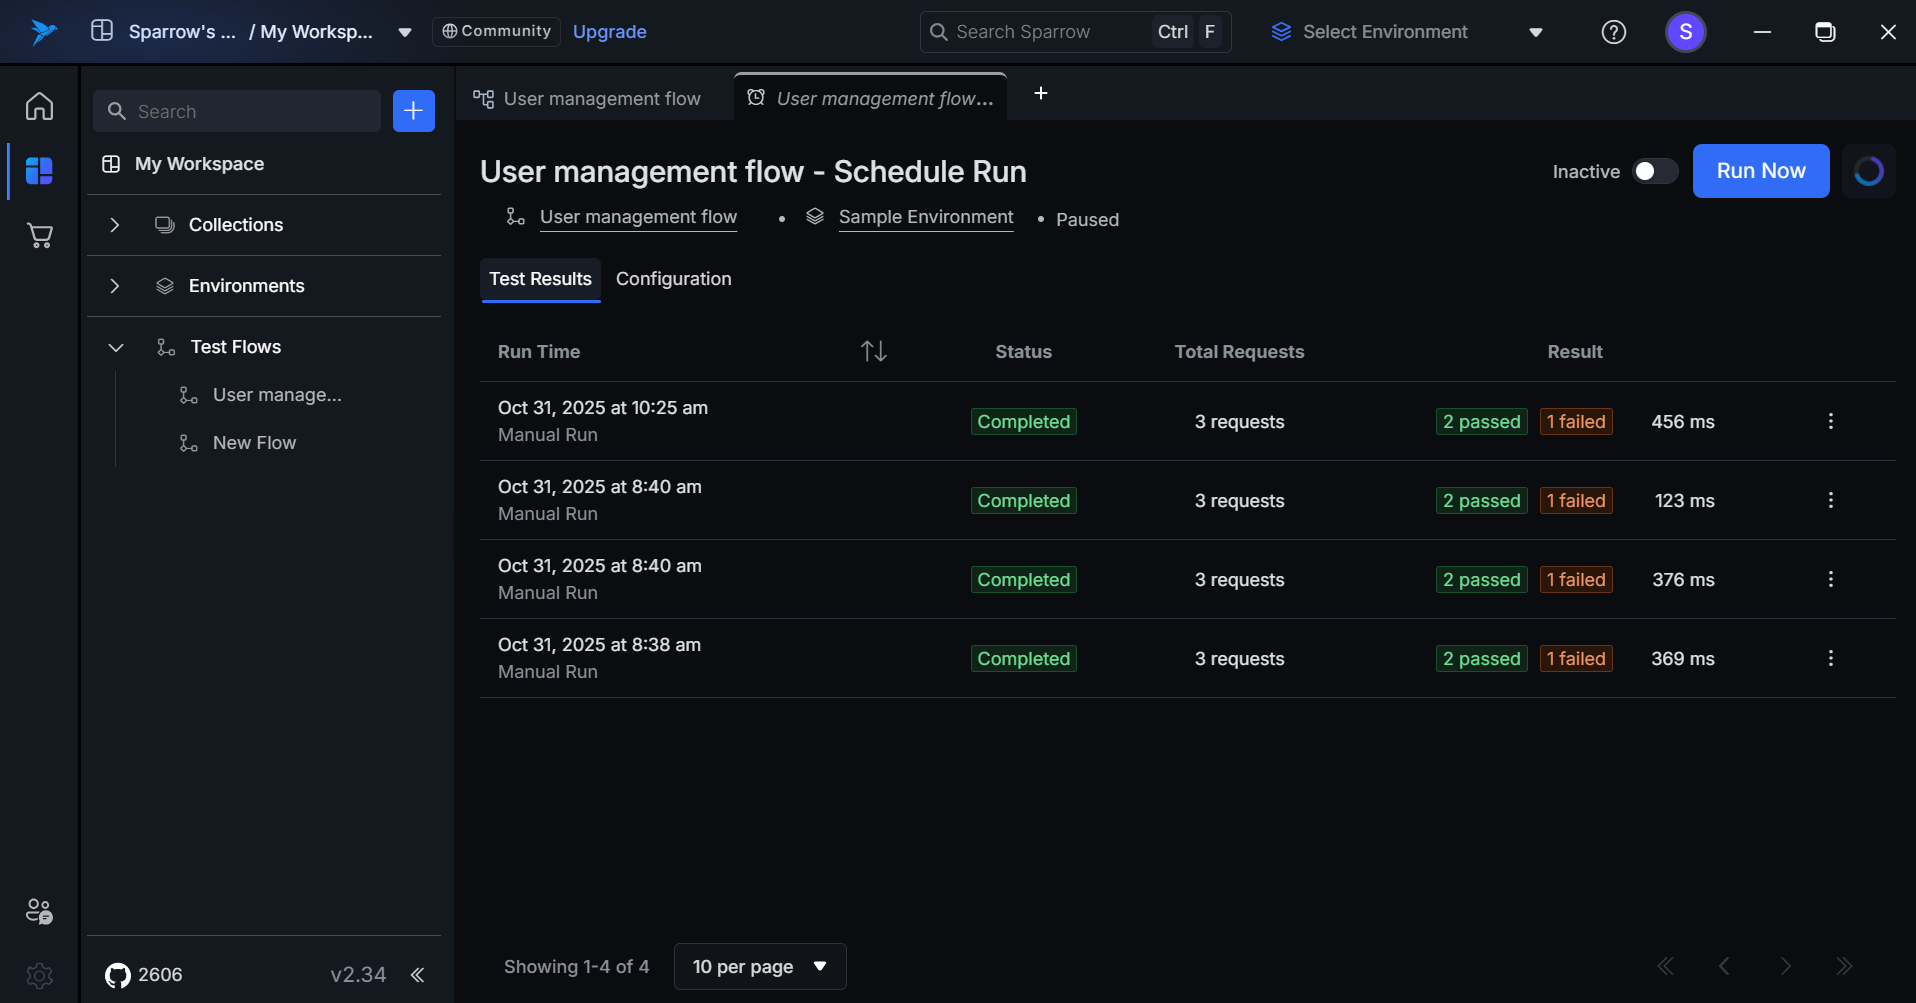
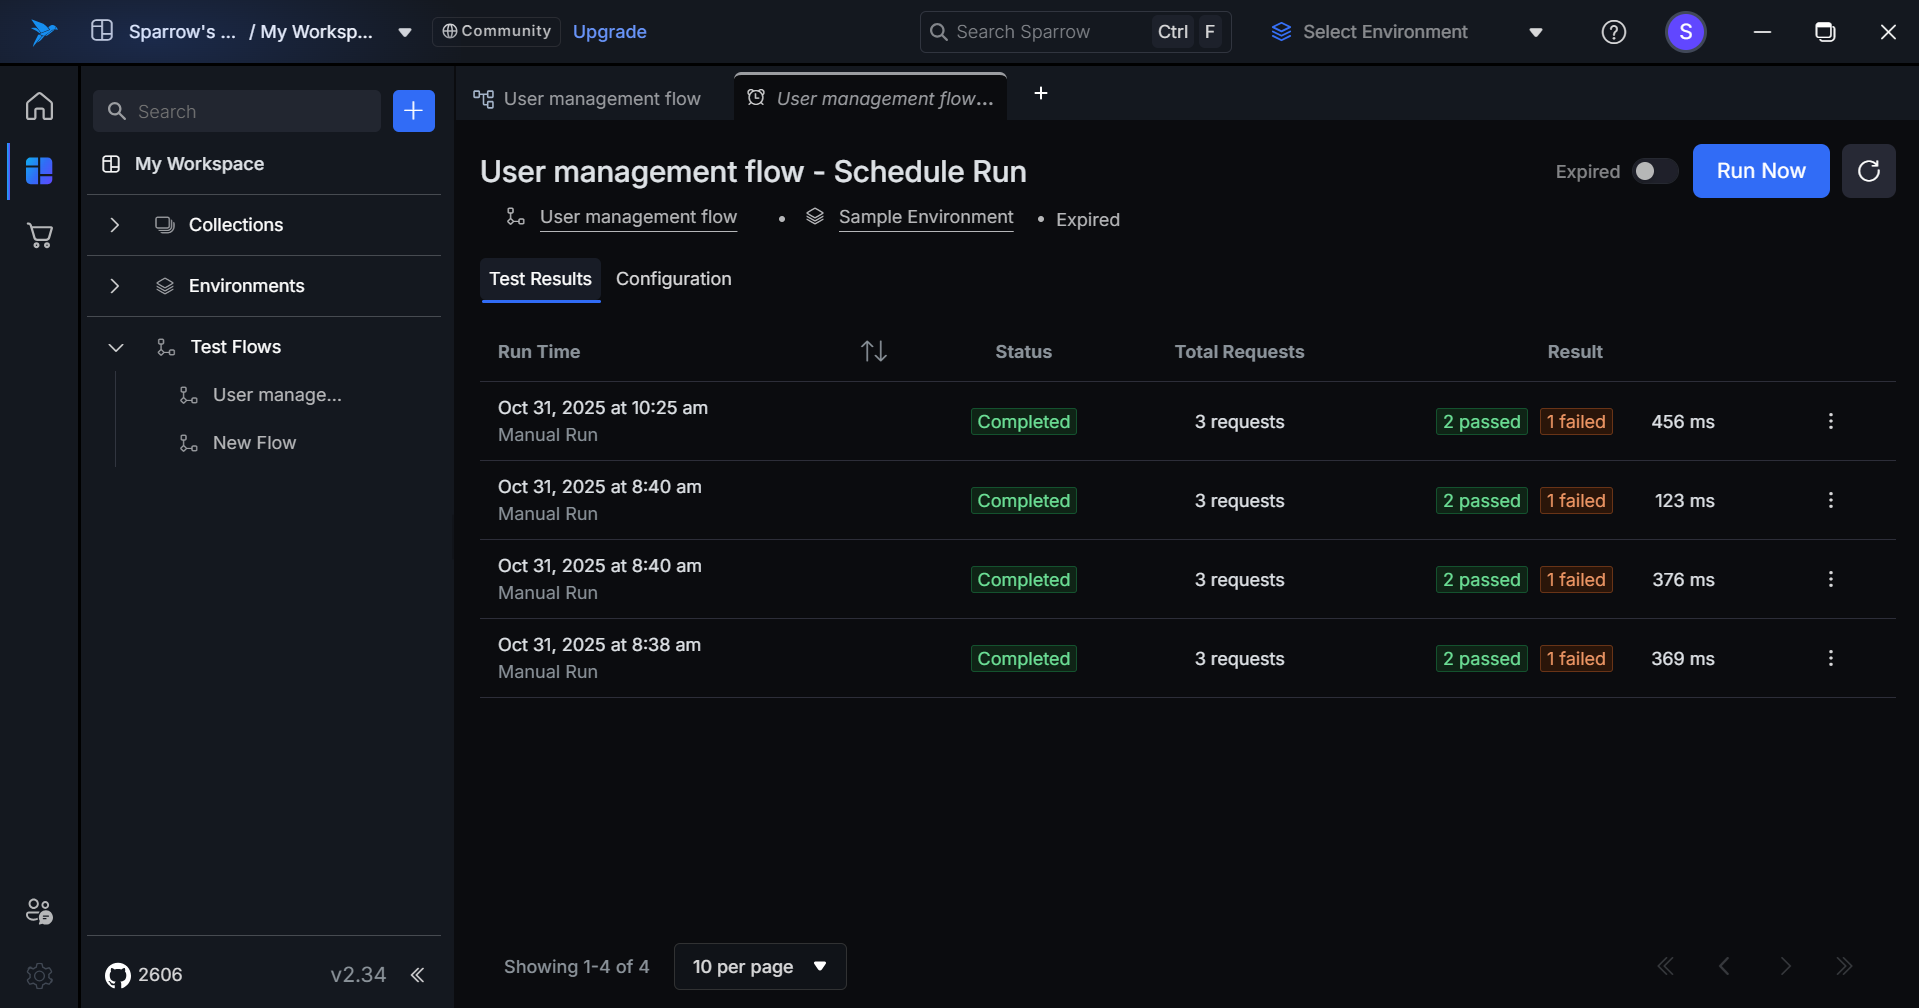
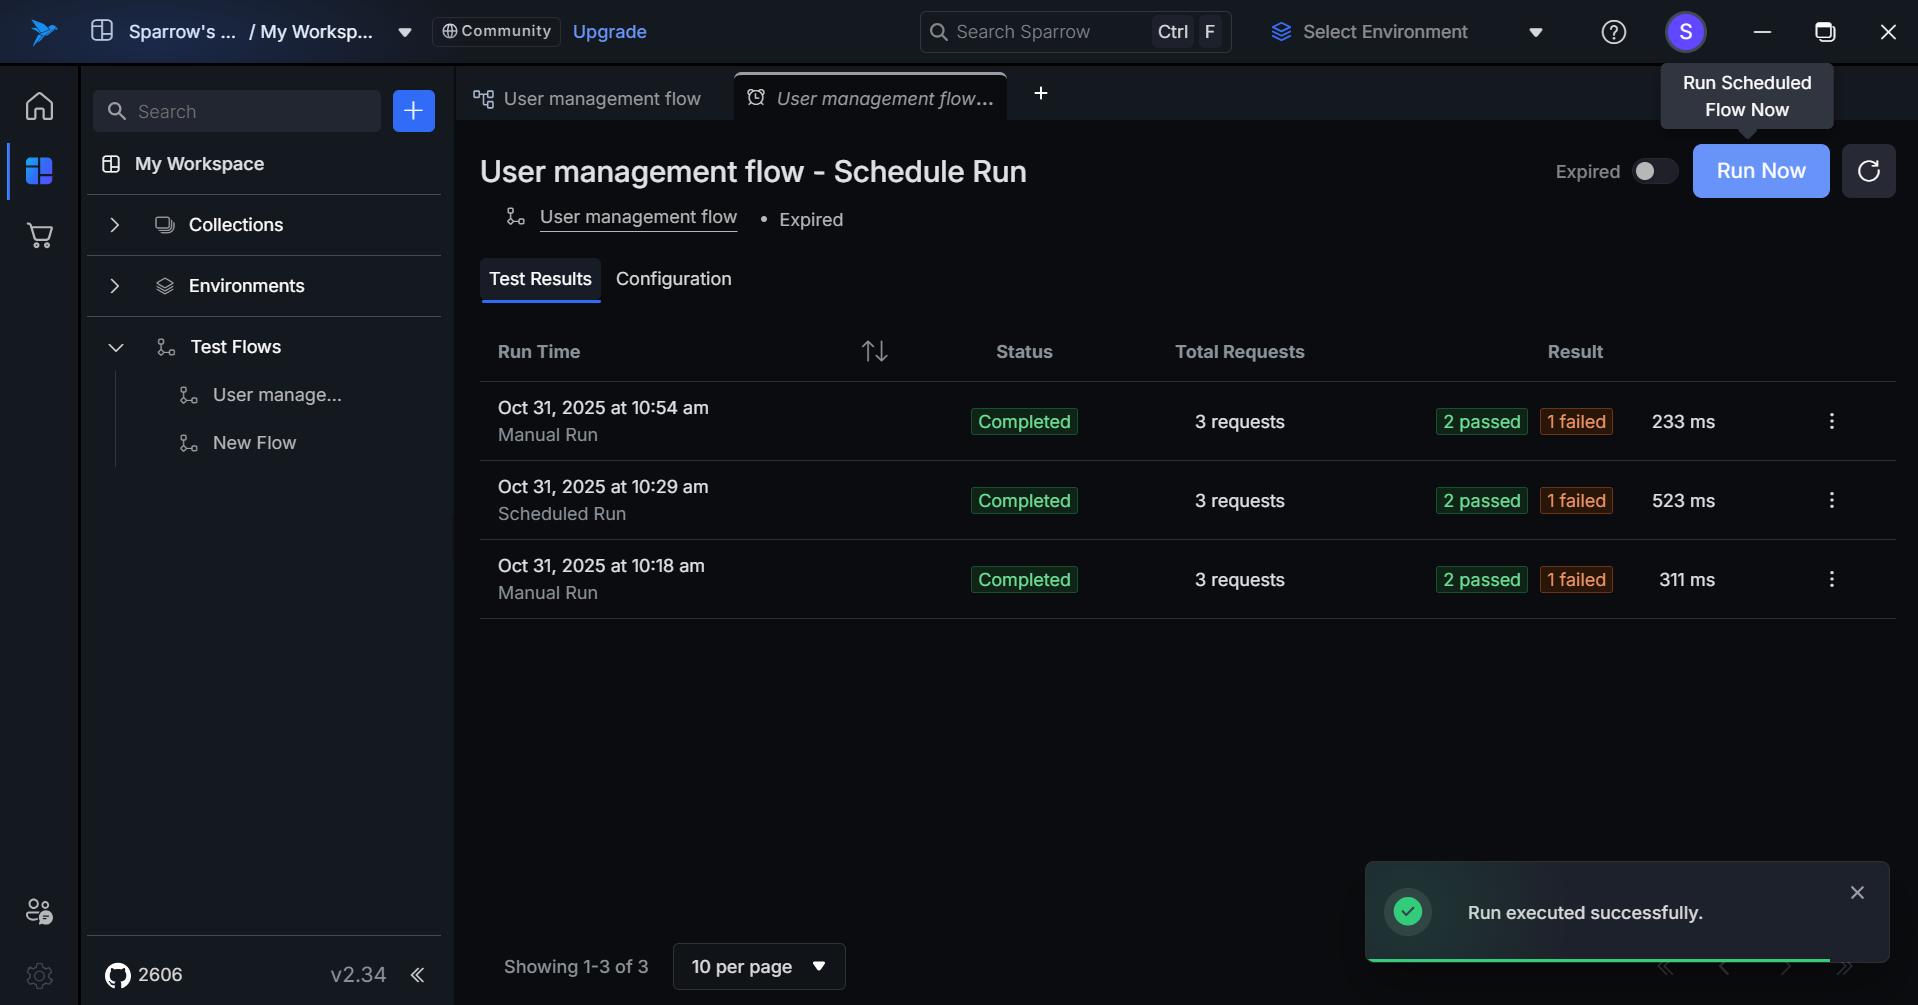
Test Results - Filled
The Test Results tab displays a chronological history of all executed test runs for the schedule, providing quick visibility into execution outcomes and performance metrics.
Components
Run Time
- Displays the execution date and time.
- Shows run type: "Schedule Run" for automated executions or "Manual Run" for Run Now triggers.
- Sortable by clicking the column header.
Status
- Completed (green badge) – Run finished successfully.
- Error (orange badge) – Run failed due to execution error (not a test failure).
Total Request
- Shows the number of API requests executed in the run.
- Example: "3 Requests"
Result
- Passed Count (green badge) – Number of successful tests.
- Failed Count (orange badge) – Number of failed tests.
- Execution Time – Total duration in milliseconds (ms).
- Example: "1 Passed | 2 Failed | 100 ms"
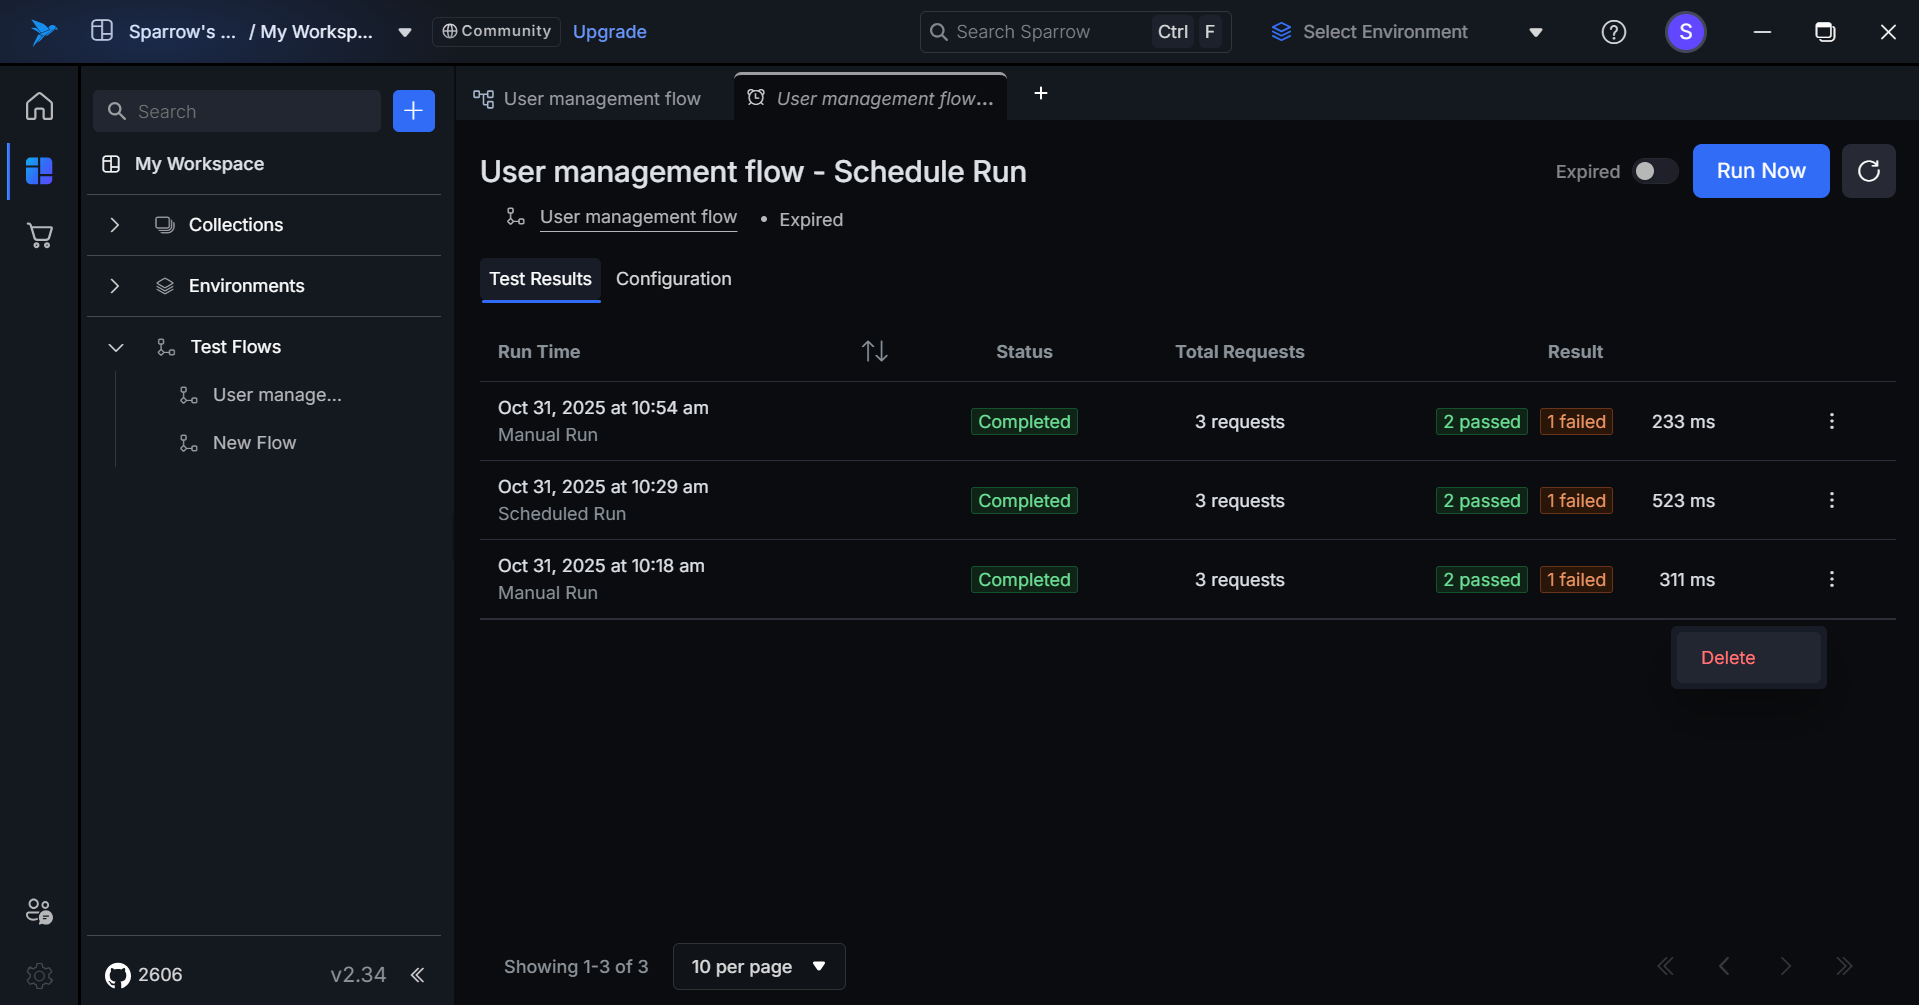
Actions
- Three-dot menu for additional options (view details, re-run, etc.).
Additional Features
- Pagination – Shows page status (e.g., "1-8 of 8") with an items-per-page selector (10 per page).
- Navigation – Previous/next page controls are available at the bottom-right.
- Click to View – Click any row to see detailed test results and logs.
- Manual vs Scheduled – Clear distinction between automated and manually triggered runs is maintained.
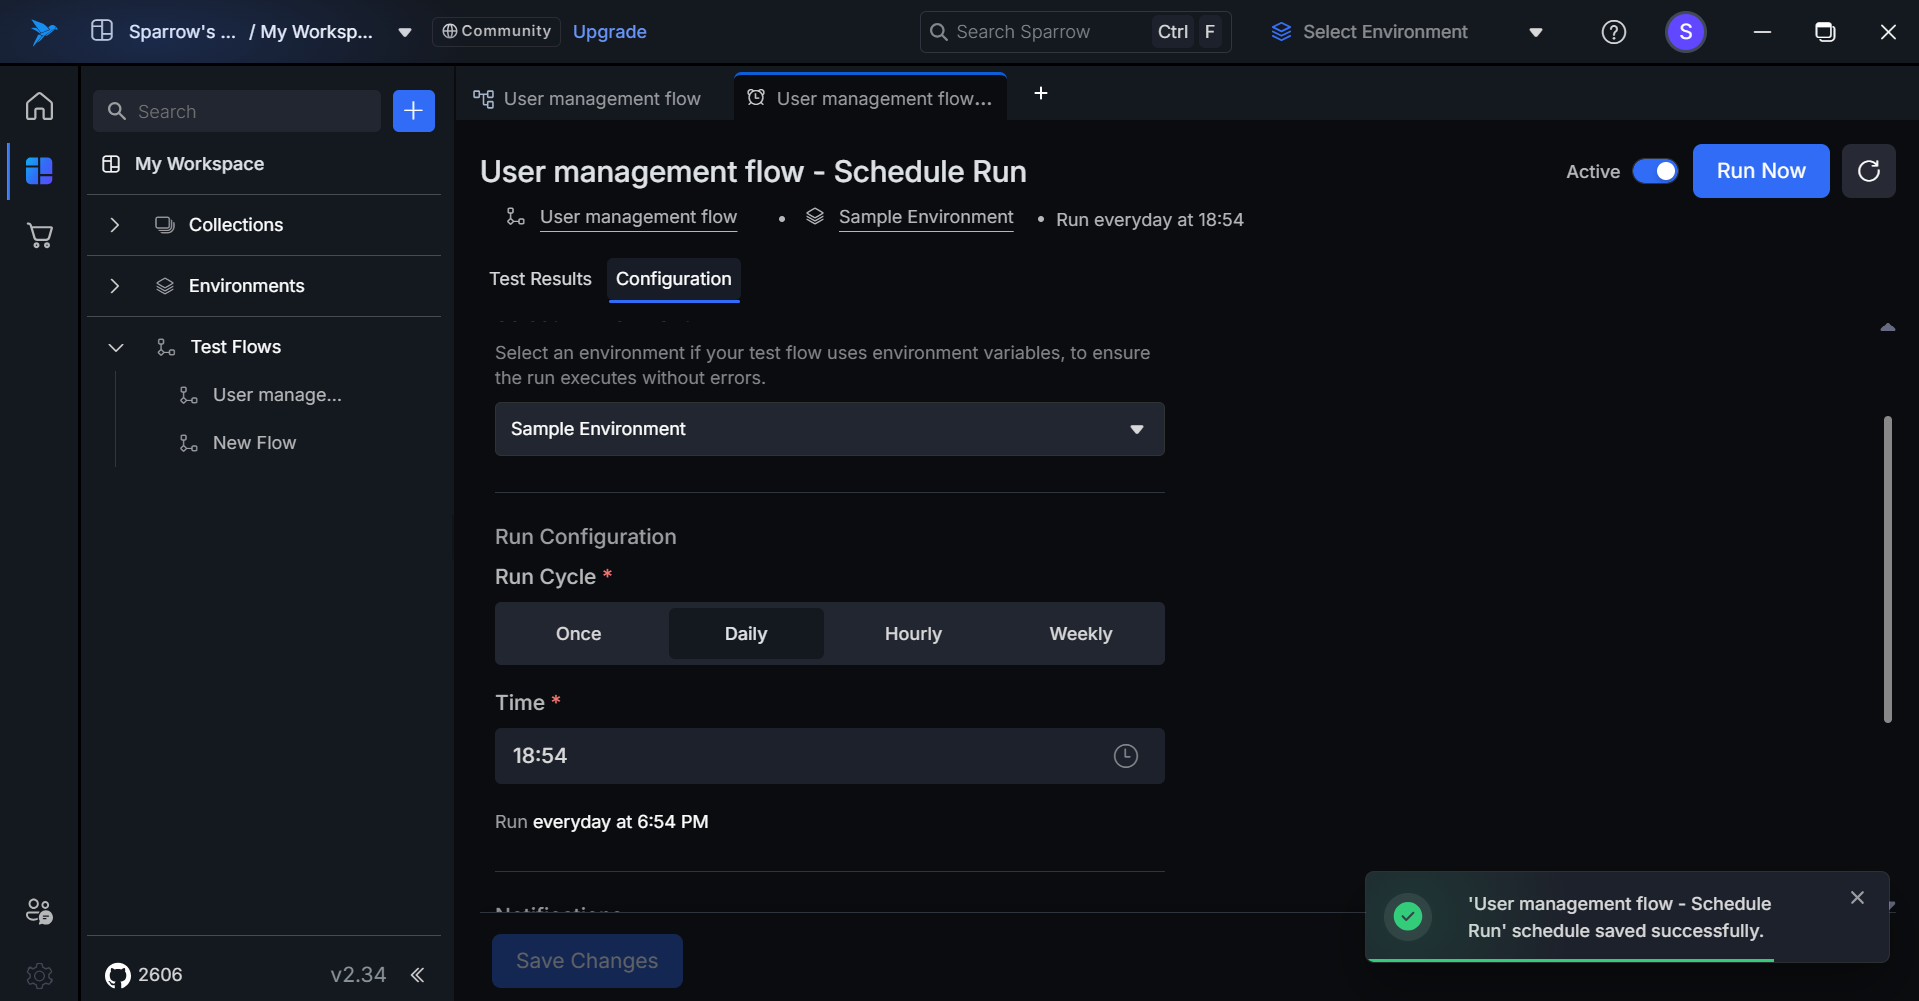
Configuration
- On clicking on the Configuration tab, you can observe the configuration settings of the schedule. You can edit it and save the changes.
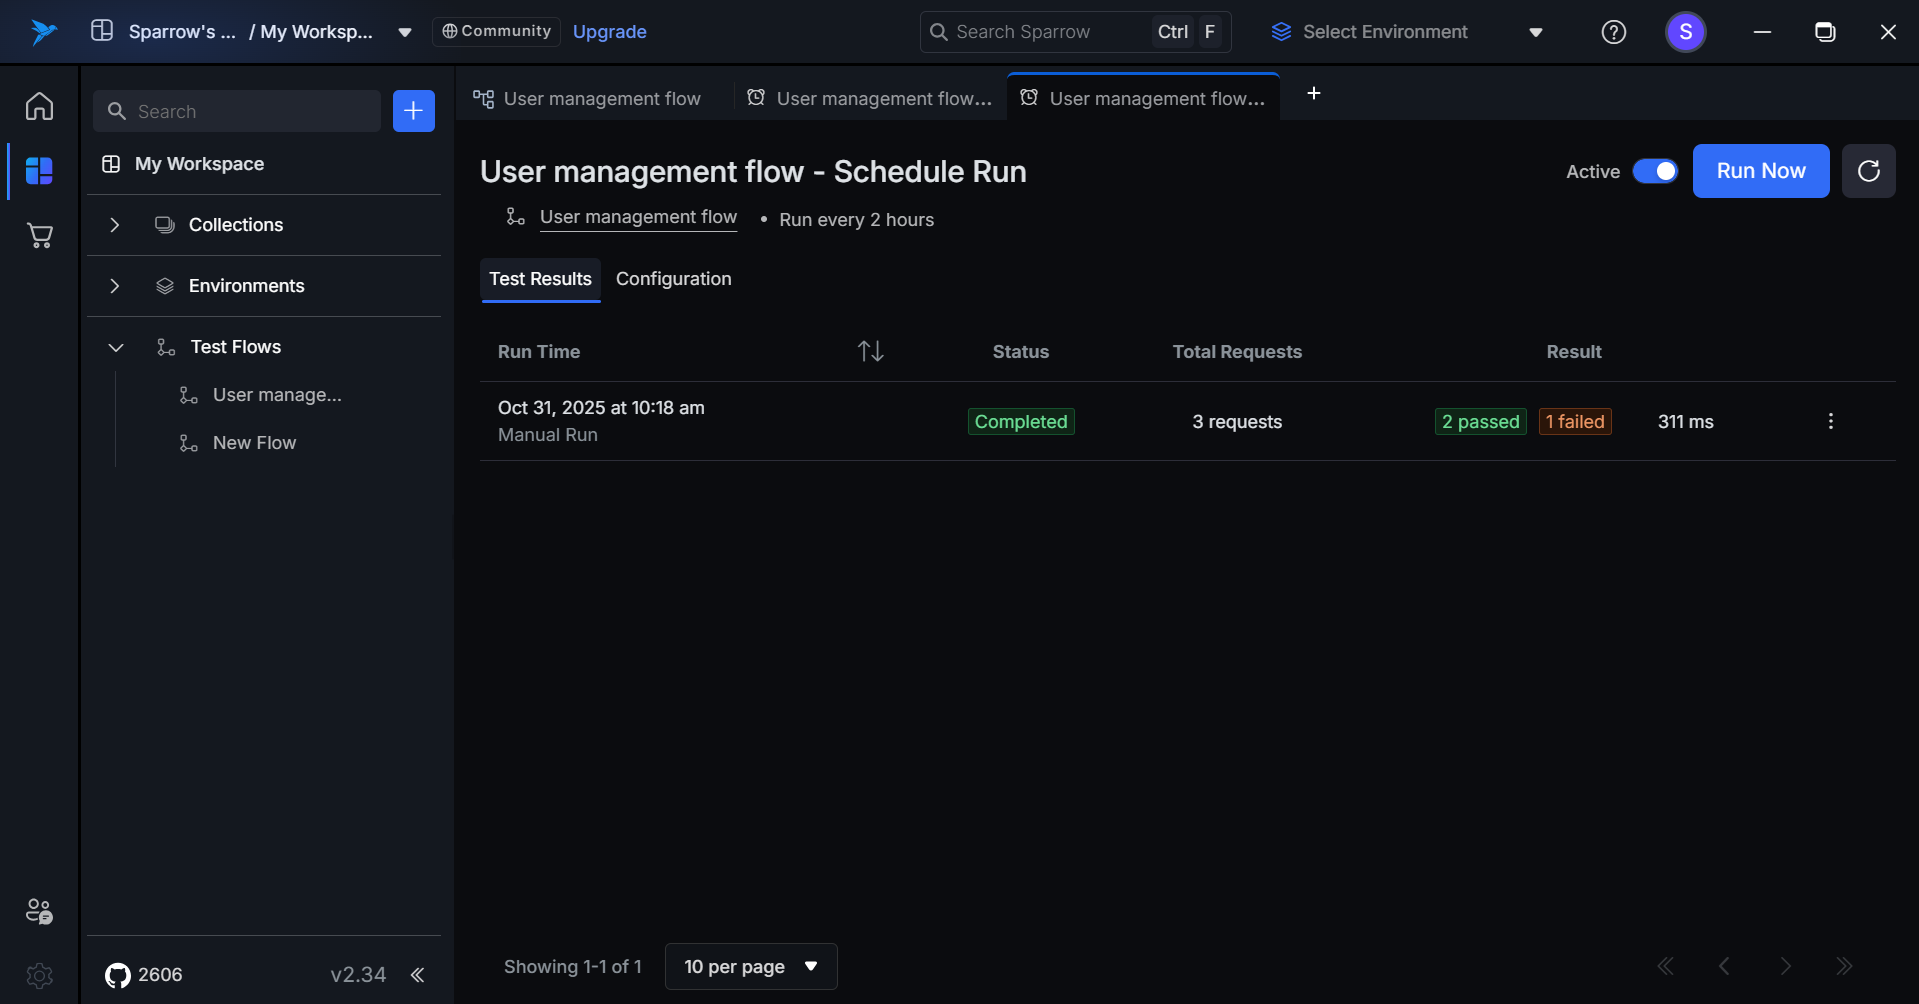
- Active Scheduled Runs: The run frequency details appear directly below the test flow name (e.g., "Run every 2 hours").
- Inactive Scheduled Runs: It is shown as Paused in the Tab.
- Expired Scheduled Runs: It is shown as Expired in the Tab.
Run Now
Run Now is a quick action button that allows users to manually trigger an immediate execution of the scheduled test flow. It is also called as Manual Run.
Click on Run Now to initiate the Manual run of the Test flow.
- Executes the test flow instantly using all current schedule settings.
- Does not affect the next scheduled run time.
- Uses the latest version of the test flow.
- Upon completion, results are automatically added to the Test Results history.
Testflow Schedule Run history.
Any completed test result can be accessed through the Test Results section of a Test Flow.
Step 1: Click on the Test Flow, Select the Scheduled Test flow you want to see the Results for and Click on the Test Results to see its history of Test Results.
Step 2: When a user clicks on a specific run result, they are redirected to the Run Result tab.
Testflow Schedule Run history with testdata.
Any completed test result can be accessed through the Test Results section of a Test Flow.
you want to see the Results for and Click on the Test Results to see its history of Test Results which includes the request and reponse of each Node.
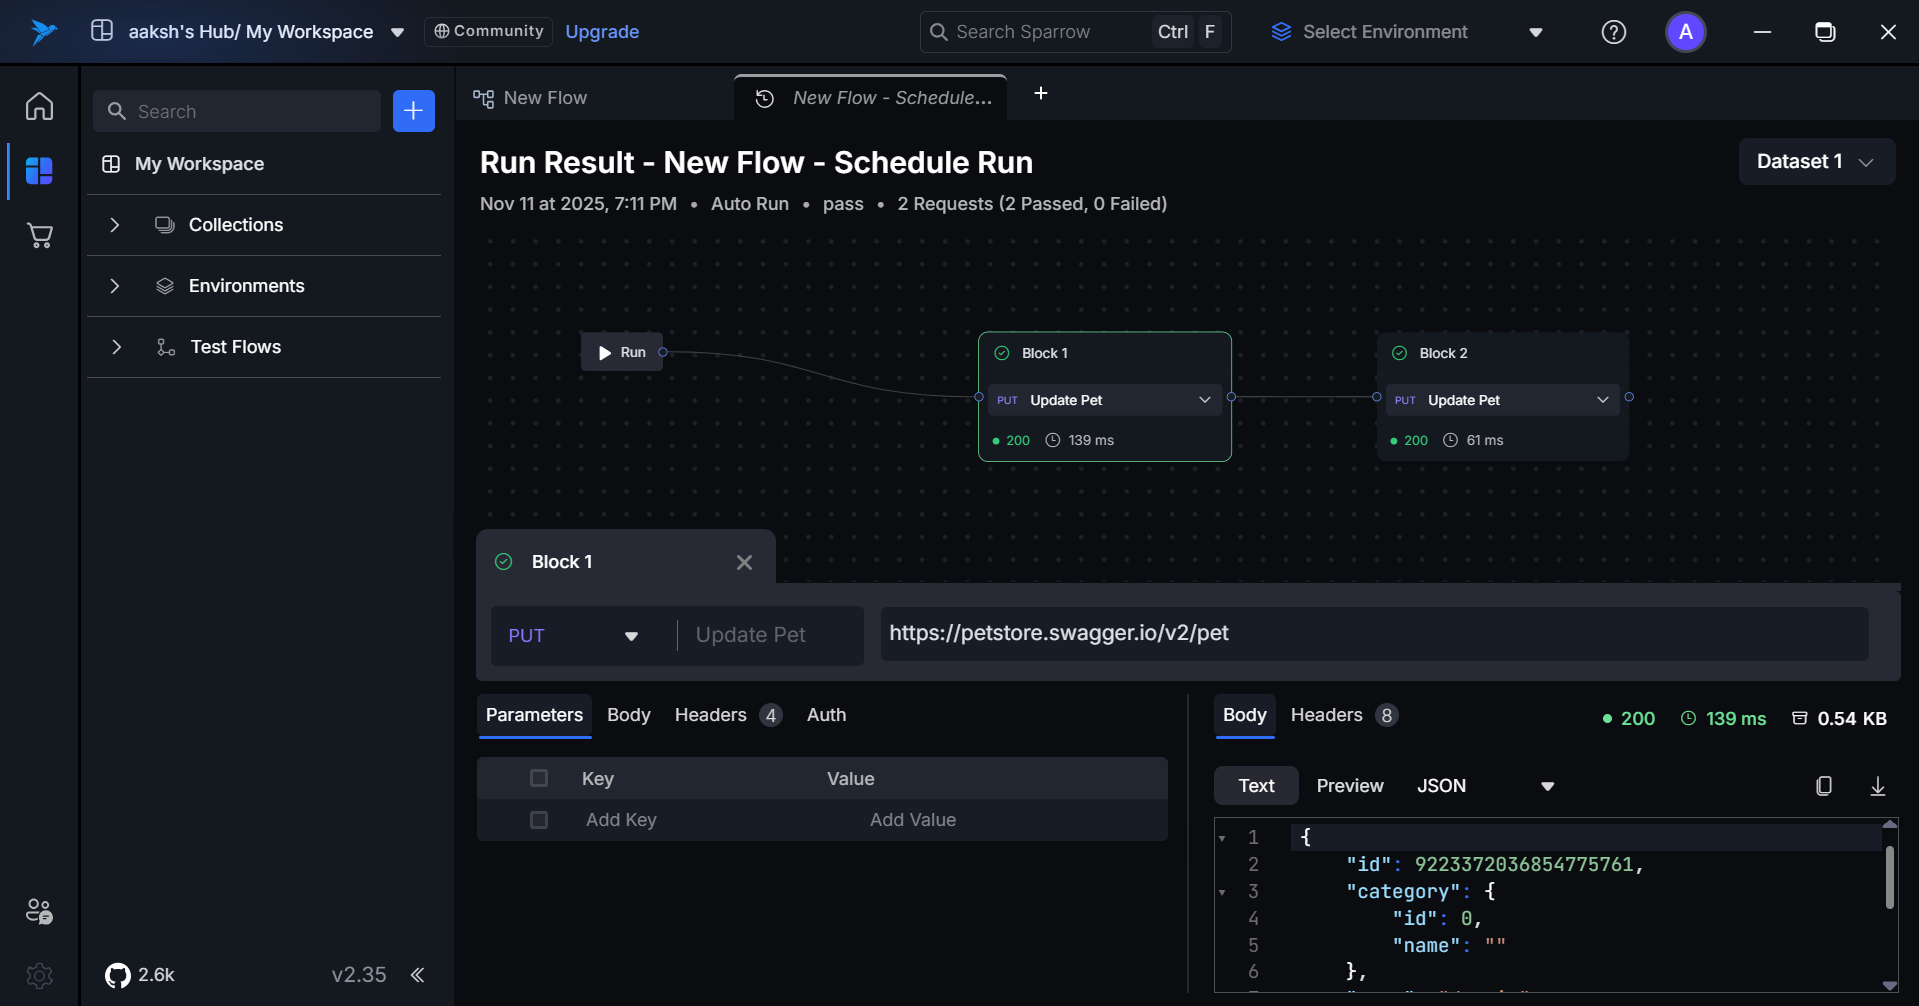
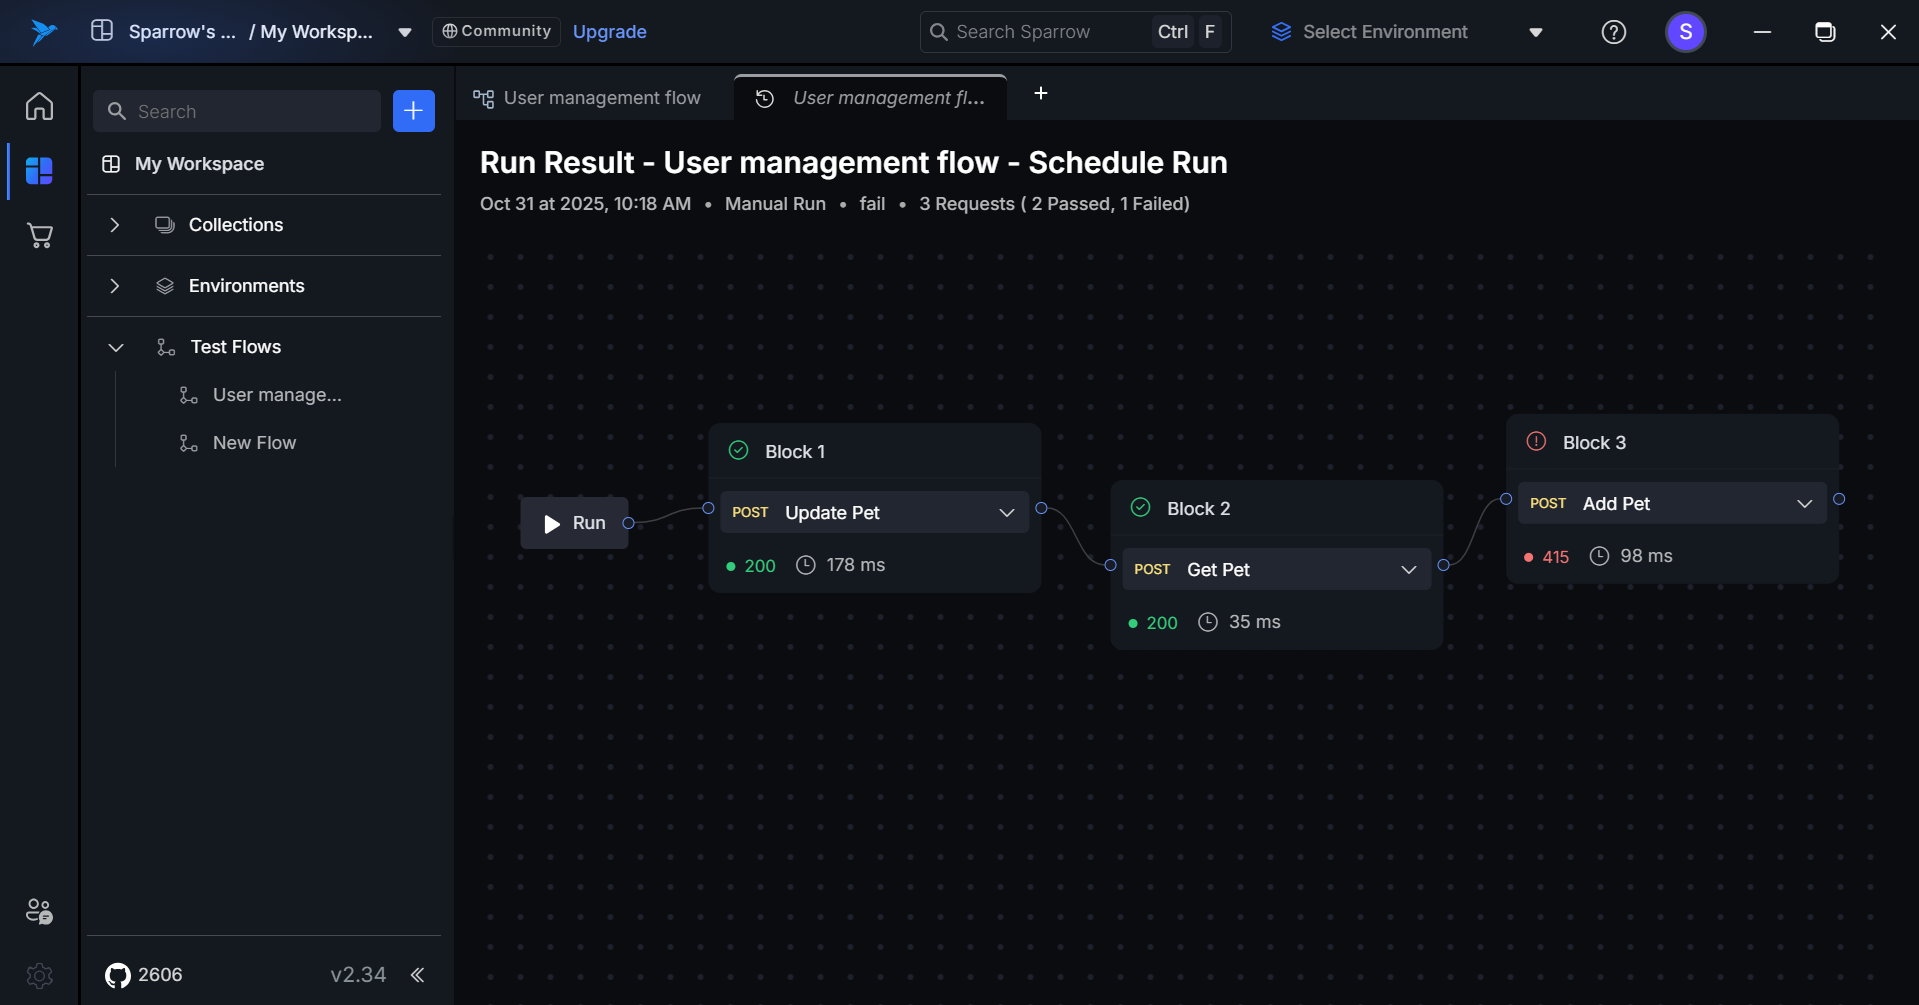
Run Result Tab Overview
The Run Result tab provides a visual representation of the entire test flow using a canvas layout.
- Flow Visualization: The canvas displays the sequence of executed blocks.
- Block Interaction: Clicking on an individual block opens its detailed view (request and response data).
- Readable Format: All data is presented in a structured and readable format.
Refresh Schedule
When a user clicks the Refresh button (Top right side), the system re-fetches the latest available data.
Click on the Test Flow, Select the Scheduled Test flow you want to see the Results for and Click on the Test Results to see its history of Test Results. Click on Refresh button which is beside "Run Now" to refresh the History.