User Management Dashboard | Sparrow Admin Manual
Overview
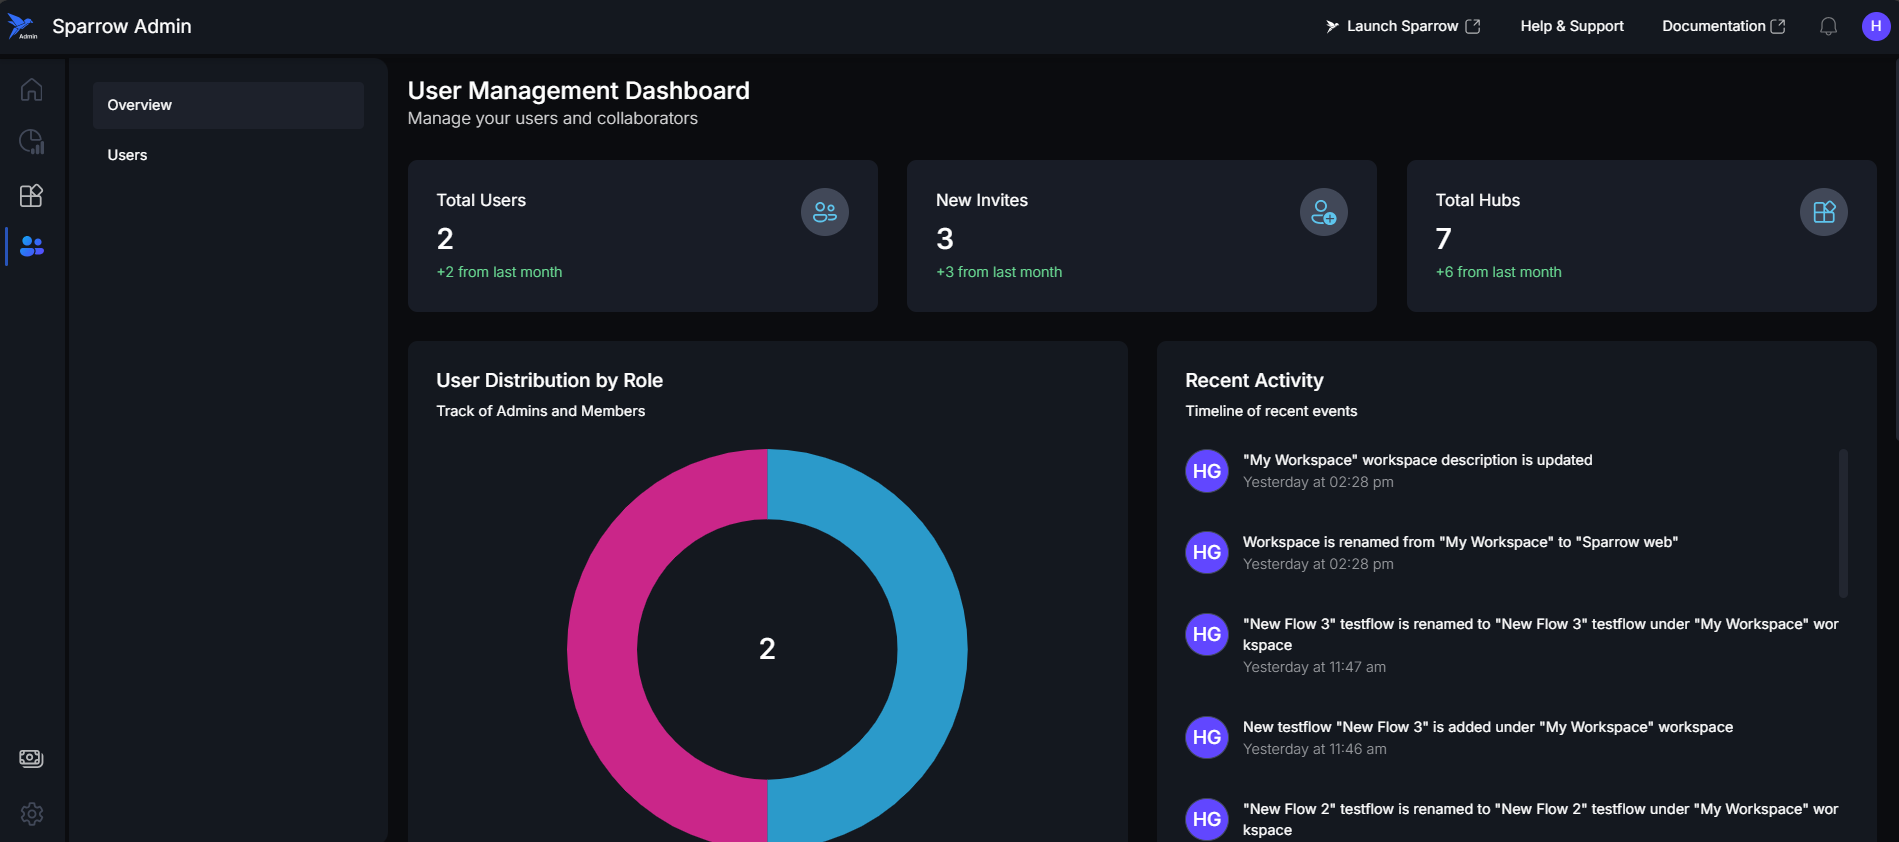
The User Management Dashboard provides administrators with a comprehensive view of user activity, team composition, and growth trends. Access it by clicking on Users and then Overview.
Dashboard Components
- Total Users: Displays current total number of users and shows monthly growth trend (e.g., "+12 from last month").
- New Invites: Number of pending user invitations and Tracks by comparing with Last month.
- Total Hubs: Total hubs created and It shows the growth from last month.
- User Distribution by Role: Donut Chart visualizing admin-to-member ratio:
- Center: Total user count
- Blue Segment: Admin users
- Pink Segment: Member users
- Purpose: Monitor role balance and delegation effectiveness.
Recent Activity Timeline
- User additions/removals
- Role permission updates
- Workspace creation
- Hub management changes
Features:
- User avatars with initials
- Clear action descriptions
- Timestamps for each event
- Scrollable feed for historical events
Monthly Role Trends
- Line Chart tracking:
- Blue Line is Admin count over time and Pink Line is Member count over time
- X-Axis: Months (Jan-Dec) and Y-Axis: User count
Use Cases:
- Identify growth patterns
- Forecast future user needs
- Monitor role balance changes
- Support capacity planning
Key Features
| Monitoring Capabilities | Administrative Actions |
|---|---|
| Real-time user metrics and growth indicators | Track user onboarding through invite metrics |
| Visual role distribution for quick assessment (Line chart) | Monitor workspace expansion via their count |
| Chronological activity feed for audit tracking | Review team activities for security and compliance |
| Historical trend analysis for forecasting | Analyze growth patterns for resource planning |
Best Practices
- Review Total Users to track adoption
- Monitor Recent Activity daily for security
- Analyze Monthly Trends for capacity planning
- Maintain healthy admin-to-member ratio (10-20%)
- Use activity logs for compliance reporting